Figure 6.
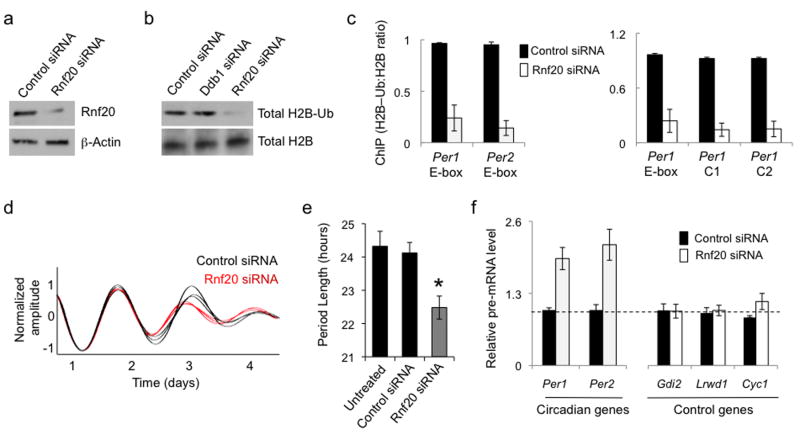
Independent reduction of H2B–Ub mimics circadian phenotypes of Ddb1 and Cul4a. (a) Immunoblots showing the effect of control siRNA or Rnf20 siRNA on the steady-state abundance of Rnf20, which globally mono-ubiquitinates H2B, in mouse fibrobloasts. β-Actin, loading control. (b) Immunoblots showing the effect of control siRNA or Rnf20 siRNA on the abundance of total H2B–Ub or H2B in mouse fibrobloasts. Uncropped images for (a) and (b) can be found in Supplementary Data Set 1. (c) Left: ChIP assays from mouse fibroblasts showing H2B–Ub (normalized to total H2B) at Per E-box sites (marked at bottom) after introduction of control siRNA (black) or Rnf20 siRNA (white). Right: ChIP assays from mouse fibroblasts showing H2B–Ub (normalized to total H2B) at Per1 gene sites (marked at bottom, as in Fig. 4d), after introduction of the indicated siRNAs. ChIP data are displayed as mean +/- SD of triplicate experiment; representative of 3 independent experiments. (d) Circadian oscillations of bioluminescence in synchronized reporter fibroblasts after delivery of control siRNA (black) or Rnf20 siRNA (red). Traces from three independent cultures are shown for each. (e) Circadian periods of fibroblasts in (d) (mean +/- SD; N = 3 cultures for each; *P < 0.005, t-test, two-tailed). (f) Quantitative RT-PCR assays showing the steady-state abundance of the indicated pre-mRNAs in mouse fibroblasts after introduction of control siRNA (black) or Rnf20 siRNA (white). Data are normalized to control (dashed line). Shown are mean +/- SD of triplicate experiment; representative of 3 experiments.

