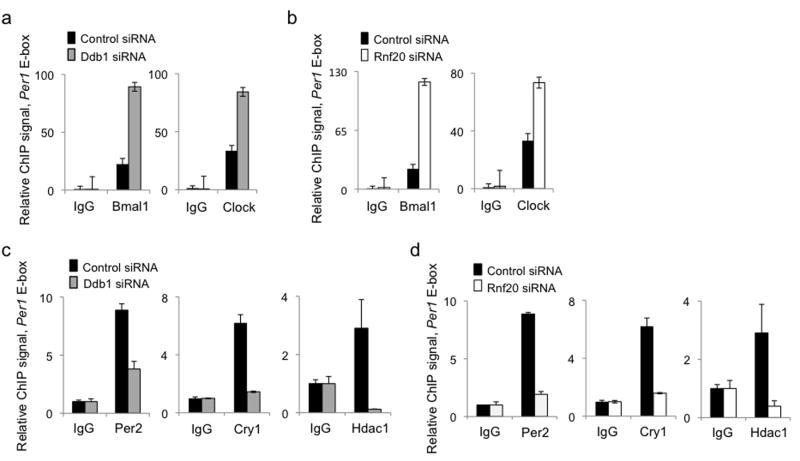
Figure 7.
H2B–Ub reduces Clock–Bmal1 and stabilizes the Per complex at Per gene E-box sites. (a) ChIP assays from mouse fibroblasts showing Bmal1 and IgG control (left) or Clock and IgG control (right) at Per1 E-box site after introduction of control siRNA (black) or Ddb1 siRNA (gray). (b) ChIP assays as in (a) after introduction of control siRNA (black) or Rnf20 siRNA (white). (c) ChIP assays from mouse fibroblasts showing Per complex proteins Per2 (left), Cry1 (middle), and Hdac1 (right) at Per1 E-box site after introduction of control siRNA (black) or Ddb1 siRNA (gray). (d) ChIP assays as in (c) after introduction of control siRNA (black) or Rnf20 siRNA (white). Shown in (a-d) are mean +/- SD of triplicate experiment; each representative of 3 experiments.

