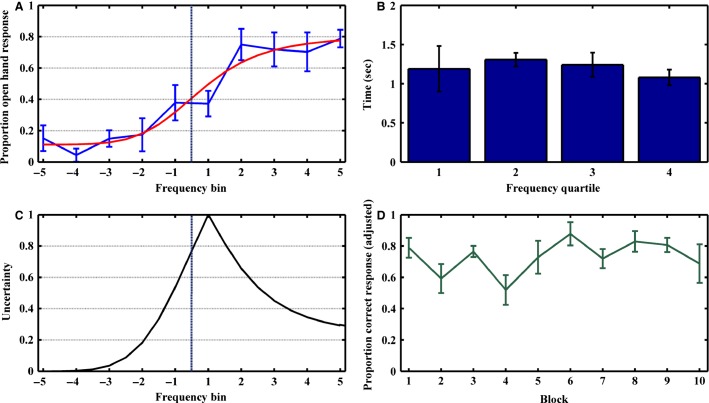
Figure 2.
Behavioral results. (A) Proportion of open-hand responses as a function of tone frequency relative to threshold. As the threshold frequency varied for different subjects, frequencies were standardized by sorting them into five logarithmically equally-spaced frequency bins above and below the threshold frequency. Each point represents mean proportion correct for the six subjects for each frequency bin. The vertical black lines represent ± SEM. The black curve represents the psychometric function. The hashed vertical black line represents threshold frequency. (B) To create an uncertainty function (inverted V), the average psychometric function was rectified around the point of subjective equivalence (PSE) and normalized to the range 0 to 1. The PSE is the maximum uncertainty (uncertainty = 1), and the lowest point of uncertainty was set to zero. (C) Response times were greater for near-threshold frequency tone trials, but the effect was not statistically significant. (D) Subject trials were divided into ten equally sized blocks to create a line representing proportion correct response (black line) as a function of cumulative experience across all six subjects. The black vertical lines are ± SEM. Across all subjects, no significant learning occurred throughout the experiment (F(9) = 0.67; R2 = 0.08; P = 0.44).

