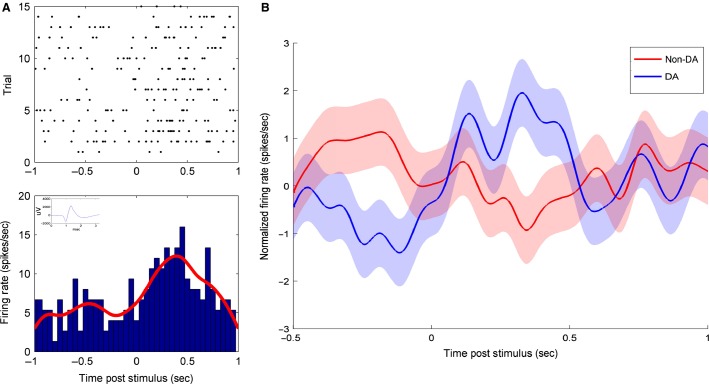
Figure 3.
SN dopamine neurons increase their firing rates following cue presentation. (A) Raster plot and peristimulus time histogram (PSTH) for a characteristic SN dopaminergic neuron. The action potential waveform is depicted in the bottom-right inset in blue. This neuron demonstrates a characteristic increase in firing rate 50–500 msec following cue presentation, the a priori period of interest. (B) Mean normalized population histogram firing rate for nondopaminergic and dopaminergic SN neurons. While the population of dopamine neurons demonstrate an increase in firing rate following cue presentation, nondopaminergic neurons show no such increase.

