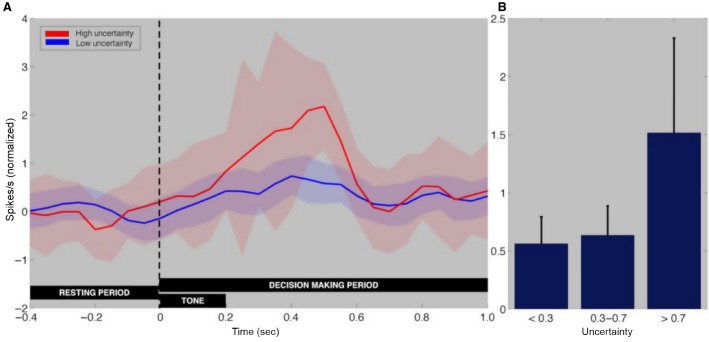
Figure 5.
Comparison of SN dopamine neuronal firing rate during uncertain conditions. (A) Mean normalized putative dopaminergic firing rate from −400 msec to 1 sec relative to tone onset for the highest (>0.7; red) and lowest (<0.3; blue) uncertainty trials. The curves depict the mean normalized firing rate across all dopaminergic neurons (n = 34) per 50-msec interval by trial type for the period 400 msec to 1 sec relative to tone onset. The shaded area represents ± SEM. (B) Mean normalized firing rate for all dopaminergic neurons for three levels of uncertainty [low (uncertainty < 0.3), medium (0.7 > uncertainty > 0.3), and high (uncertainty >0.7)] in the interval 50–500 msec following tone onset. The bars reflect ± SEM. Average normalized neuronal firing rate reveals a nonsignificant trendwise increase with uncertainty (ANOVA; Low: 0.56 ± 0.23; Medium, 0.63 ± 0.25; High: 1.52 ± 0.82 normalized spikes/sec; F(2) Uncertainty = 1.47; P = 0.23).

