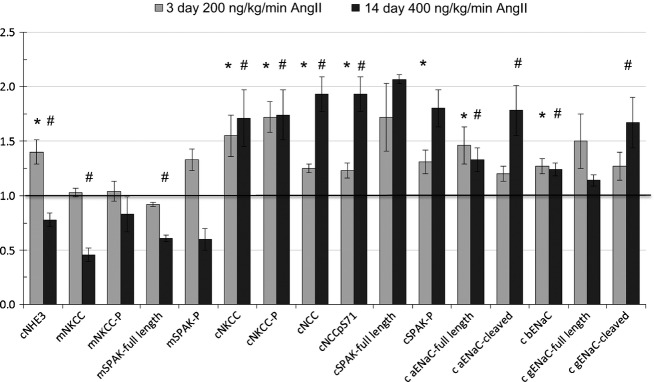
Figure 7.

Renal transporter profiles of Sprague Dawley rats infused with 3 day versus 2 week subpressor regimes of angiotensin II. Data from subpressor AngII treatment (200 ng AngII/kg/min for 3 days, light gray bars, n = 7) are summarized from Figures 6 and normalized to relative abundance in control rats infused with saline (defined as =1, indicated with a horizontal line at 1.). Data from longer AngII treatment (400 ng/kg/min × 12 days, dark gray bars, n = 8) are summarized from Nguyen et al. (2014) and also normalized to saline-infused controls. Note: only one phosphorylated form of NCC is included as the other forms change in the same directions. *P < 0.05 versus saline infused rats in 3-day AngII study, #P < 0.05 versus saline infused rats in 2-week AngII study.
