Figure 1.
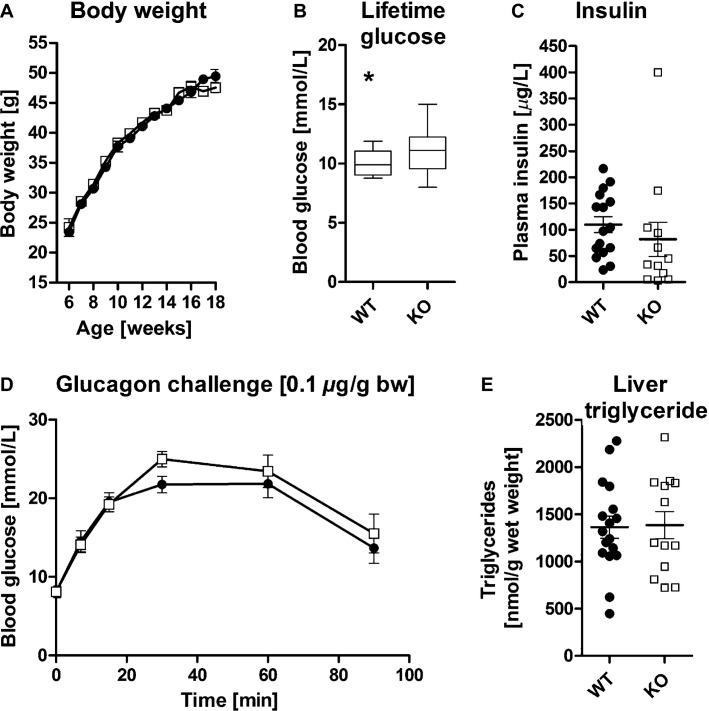
Phenotypic analysis of Aqp9wt and Aqp9−/− C57BL/6 db/db mice. (A) Body weight increased similarly in Aqp9wt and Aqp9−/− mice (mean, SEM). (B) Cumulative analysis of life-time blood glucose levels revealed elevated blood glucose in Aqp9−/− mice (P = 0.02; whiskers indicate min–max). (C) Plasma insulin data as shown were not normally distributed for AQP9−/− mice (D'Agostino & Pearson omnibus normality test, P < 0.0001). Accordingly, log2-transformed data analysis showed reduced plasma insulin in AQP9−/− mice (P = 0.03, mean, SEM). (D) Glucagon challenge induced similar elevation in blood glucose in both genotypes (mean, SEM). (E) Liver TAG content did not differ between genotypes. Aqp9wt (WT), solid discs; Aqp9−/− (KO), open squares. Differences between groups were assessed by two-way ANOVA (A, D) or Student's t-test (B, C, E), for n = 25 (KO) and n = 46 (WT) in (A, B), n = 12 (KO) and n = 16 (WT) in (C), n = 11 (KO) and n = 12 (WT) in (D), and n = 13 (KO) and n = 17 (WT) in (E).

