Figure 2.
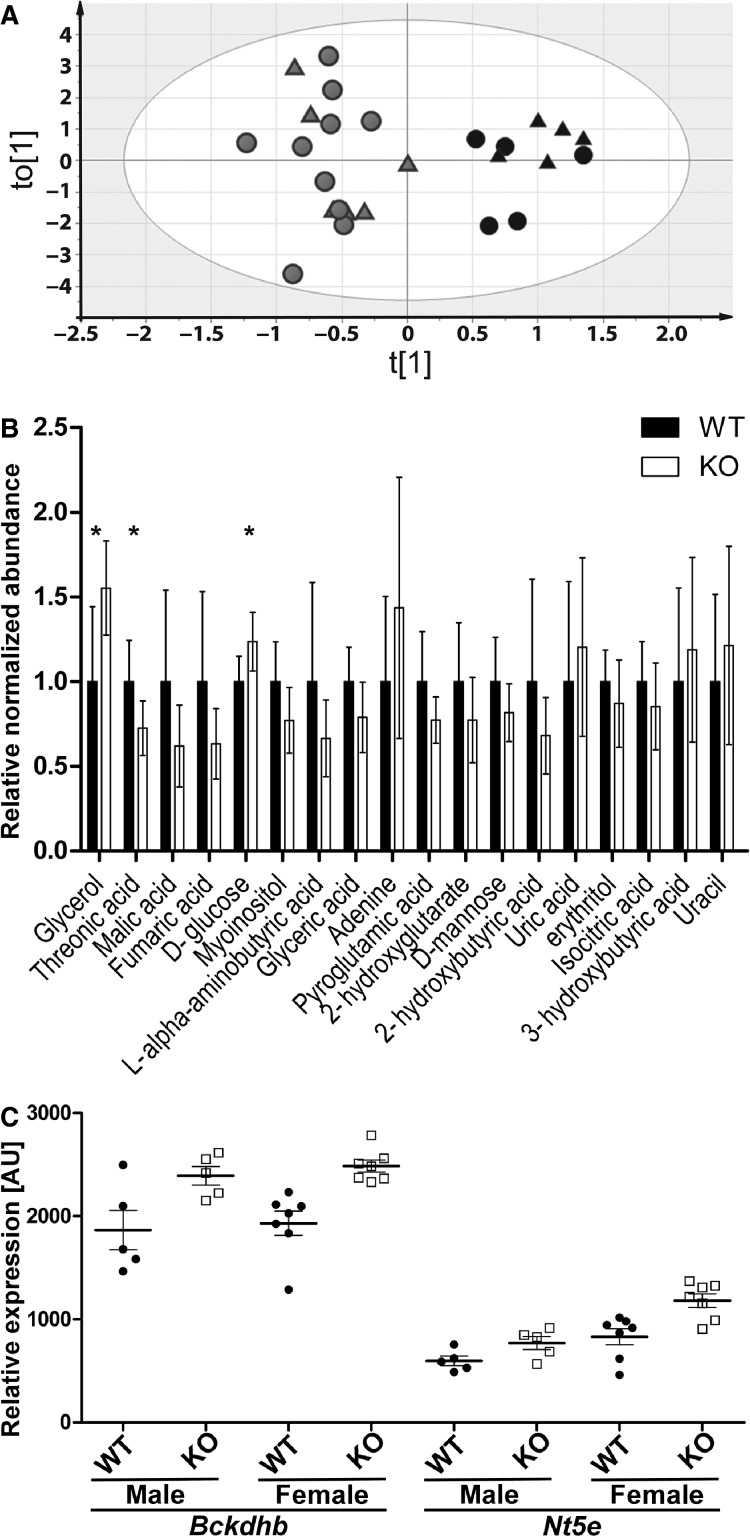
Analysis of GC-MS and microarray gene expression profiling of C57BL/6 db/db Aqp9wt and Aqp9−/− mice. (A) OPLS-DA facilitates plasma sample classification by genotype, indicating systematic differences in plasma metabolite profile between Aqp9−/− and Aqp9wt mice. Black = Aqp9−/−; gray = Aqp9wt; circle = male; triangle = female. (B) Relative abundance of plasma metabolites of OPLS-DA VIP score >1 in Aqp9wt (WT) and Aqp9−/− (KO) mice. VIP scores are sorted from left-highest to right-lowest. Metabolites with FDR < 0.1 in univariate statistics (*). (C) Relative gene expression of Bckdhb and Nt5e in Aqp9wt (WT) and Aqp9−/− (KO) mice, t-test: Bckdhb P = 0.0355 (male), P = 0.0036 (female); Nt5e P = 0.0599 (male), P = 0.0113 (female), FDR > 0.1.

