Figure 3.
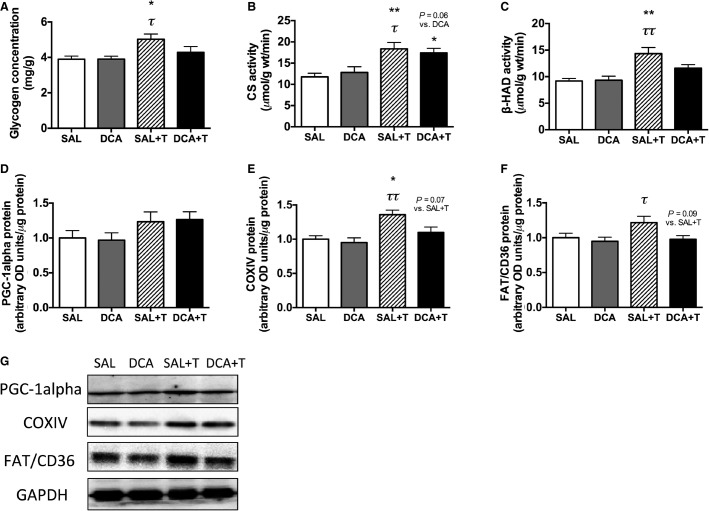
(A) Glycogen concentration, the activities of (B) CS and (C) β-HAD, and protein levels of (D) PGC-1alpha, (E) COXIV, and (F) FAT/CD36 in the white gastrocnemius muscle after 4 weeks of saline (SAL) or DCA (DCA) administration without training and high-intensity interval training with pre-exercise saline (SAL + T) or DCA (DCA + T) administration. Representative bands (G). Values are means ± SE (N = 5–8). *P < 0.05, **P < 0.01 versus the SAL group. τ P < 0.05, ττ P < 0.01 versus the DCA group.

