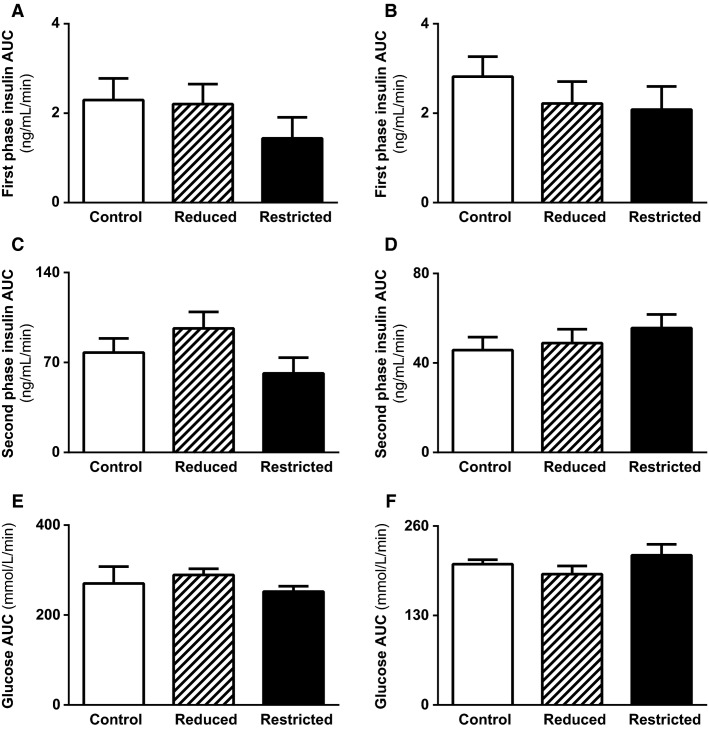
Figure 4.
Insulin secretion and whole body insulin sensitivity in male and female offspring. Insulin secretion was measured in response to a glucose load. First-phase (A, B), second-phase (C, D) insulin AUC and whole body insulin sensitivity as measured by the glucose AUC in response to IC (E, F) in male and female Control, Reduced, and Restricted offspring. Values are expressed as means ± SEM; n = 7–10 per group. AUC, area under the curve; IC, insulin challenge.

