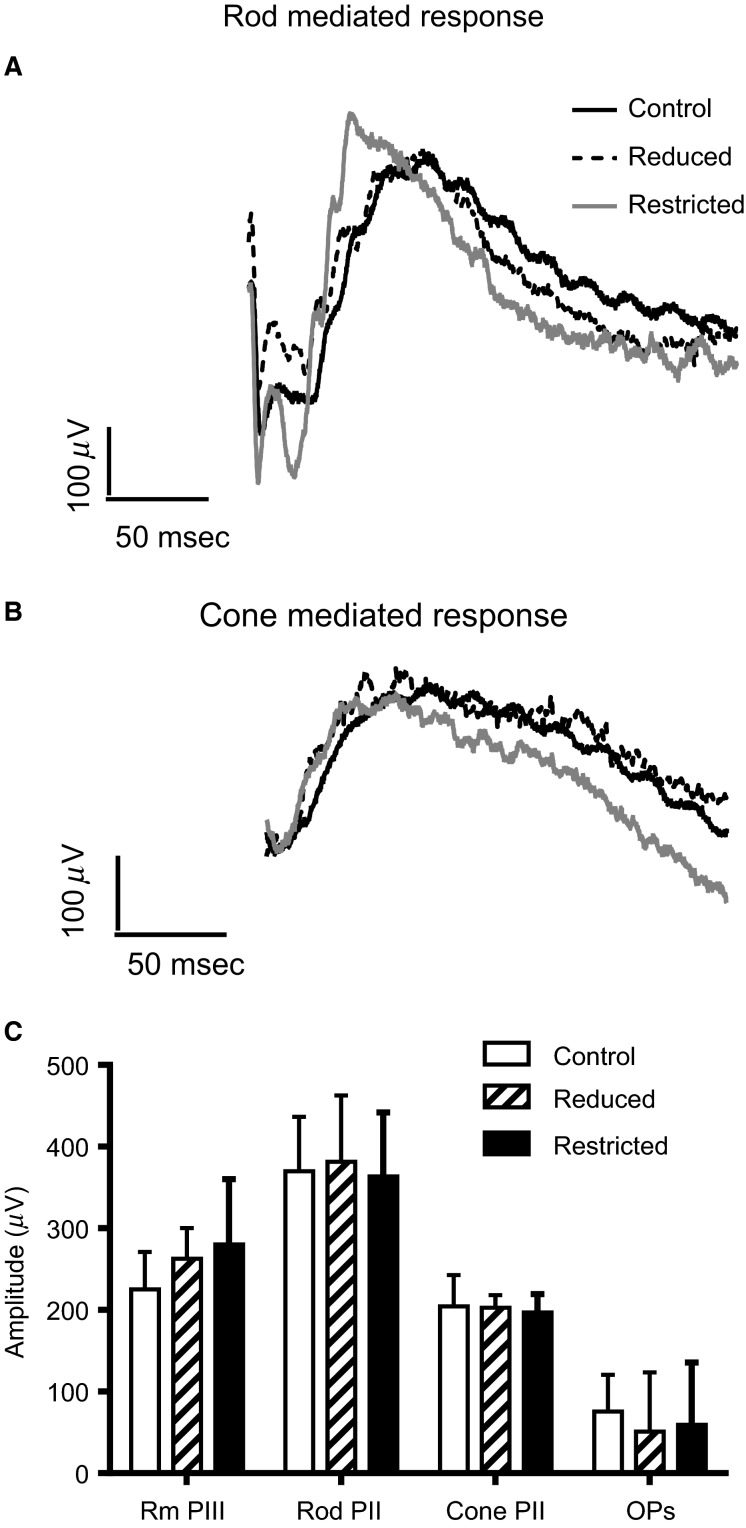
Figure 6.
Retinal function. Representative waveforms of rod-mediated (A) and cone-mediated (B) retinal function in Control, Restricted, and Reduced male rats. Graph showing the average a-wave (rod PIII), b-wave (rod PII), summed Ops, and cone b-wave (Cone PII) in Control, Reduced, and Restricted rats (C). No difference in amplitude was detected in any of the ERG parameters measured.

