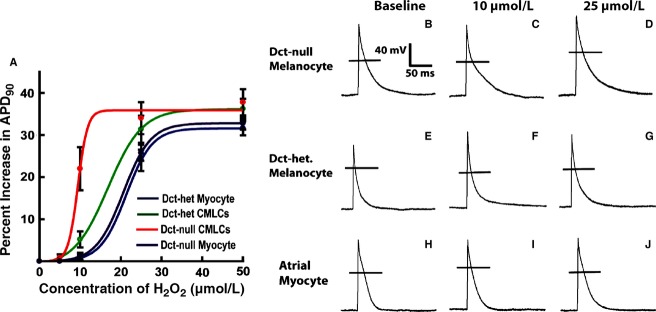
Figure 5.

Response of action potential duration in CMLCs and atrial myocytes to hydrogen peroxide. (A) Plotted are the percent increase in action potential duration at 90% repolarization to hydrogen peroxide for Dct-null CMLCs (red), Dct-het CMLCs (green), Dct-het atrial myocytes (blue), and Dct-null atrial myocytes (purple). Data points represent the mean ± standard deviation for at least 11 cells at each concentration of hydrogen peroxide. (B–J) show the electrophysiological response of CMLCs and atrial myocytes to hydrogen peroxide. Displayed are representative action potentials from Dct-null CMLCs (B–D), Dct-het CMLCs (E–G), and Dct-het atrial myocytes (H–J) at baseline (B, E, H), in 10 μmol/L H2O2 (C, F, I) and in 25 μmol/L H2O2 (D, G, J). The horizontal line (B–J) denotes the zero potential level.
