Figure 2.

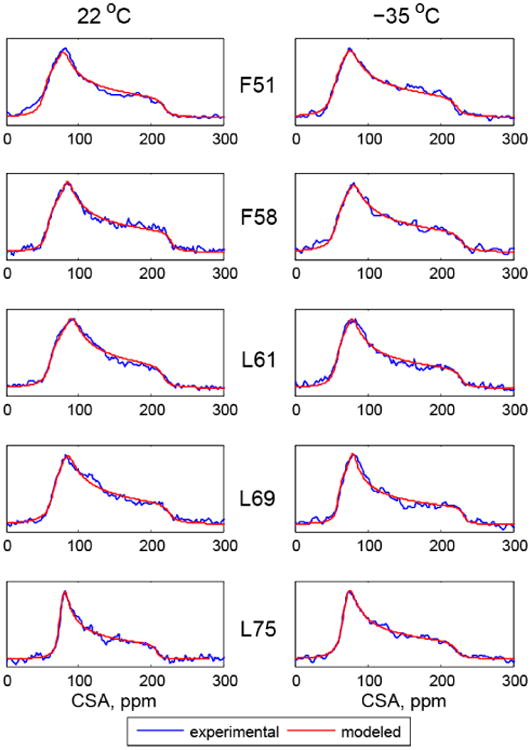
Normalized experimental (blue) and simulated (red) 15N CSA line shapes. As explained in the text, compared with experimental processing an extra line broadening of 300 Hz was used for all residues other than L75 for which 100 Hz was used.

Normalized experimental (blue) and simulated (red) 15N CSA line shapes. As explained in the text, compared with experimental processing an extra line broadening of 300 Hz was used for all residues other than L75 for which 100 Hz was used.