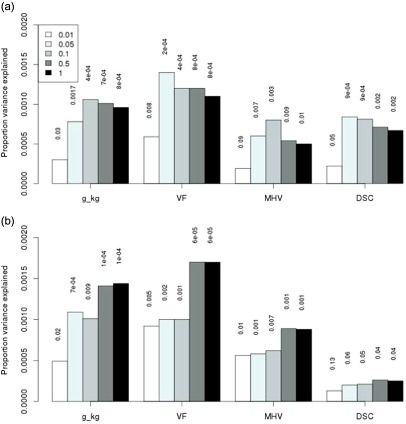
Figure 1.

(a) Proportion of variance in alcohol consumption and cognitive variables explained by SAGE AD polygenic risk score derived using five different P‐value thresholds. (b) Proportion of variance in alcohol consumption and cognitive variables explained by Yale‐Penn AD polygenic risk score derived using five different P‐value thresholds. DSC = digit symbol coding; g_kg = grams of ethanol per kg of body weight consumed per week; MHV = Mill Hill vocabulary; VF = verbal fluency. Only tests significantly associated with AD polygenic risk score from both Yale‐Penn and SAGE GWAS at the P‐value threshold P ≤ 0.5 are presented.
