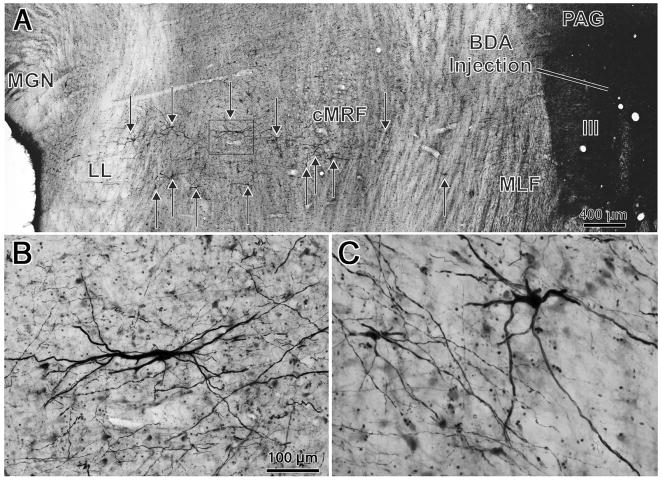
Figure 9.
Photomicrographs showing the injection of BDA into the oculomotor nucleus (III) and supraoculomotor area (A), and the distribution of labeled cells (arrows) in the central mesencephalic reticular formation (cMRF) (A) that resulted from this injection. B&C show the morphology of the homogeneously labeled neurons within the cMRF. Note the poorly branched, tapering dendrites and range of cell sizes. Box in A shows location of B. Scale in B=C.

