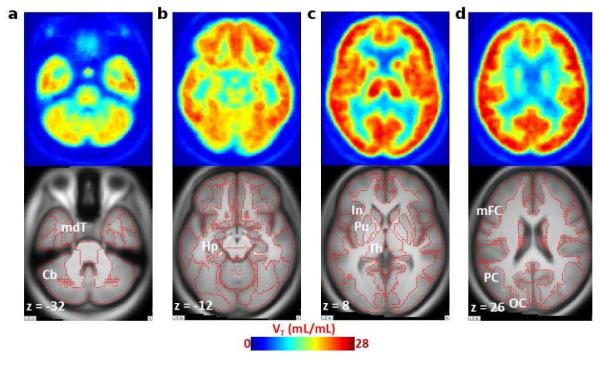
Fig. 14.

Averaged (n = 5) transaxial images of a spatially normalized VT map of [18F]ASEM and matching MRI in healthy control subjects. Cerebellum (Cb) and medial temporal cortex (mdT; panel a) show relatively low VT values and hippocampus (Hp; panel b) show medium VT values. The insula (In), putamen (Pu), and thalamus (Th) are shown in panel c, and middle frontal (mFC), parietal (PC), and occipital (OC) cortices (panel d) exhibit high VT values in the human brain. Red dots on MRI images indicate outlines of cortical and subcortical structures. Reprinted from[68] with permission of Copyright Clearance Center's RightsLink service.
