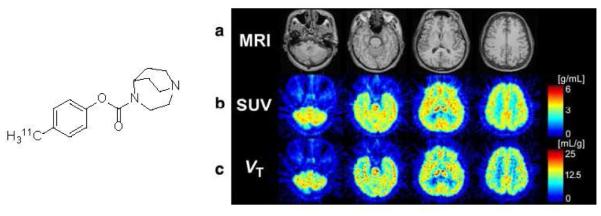
Fig. 2.

Left: Structure of [11C]CHIBA-1001. Right: PET images of human brain with [11C]CHIBA-1001. Panel a Magnetic resonance images (MRI) of the corresponding slices. Panel b Static images acquired from 0 to 90 min after injection of [11C]CHIBA-1001 expressed as SUV. Panel c A parametric image for the total distribution volume of [11C]CHIBA-1001 generated using Logan graphical analysis. The data from 30 to 90 min were applied to the Logan plot analysis. Reprinted from[49] with permission of Copyright Clearance Center's RightsLink service.
