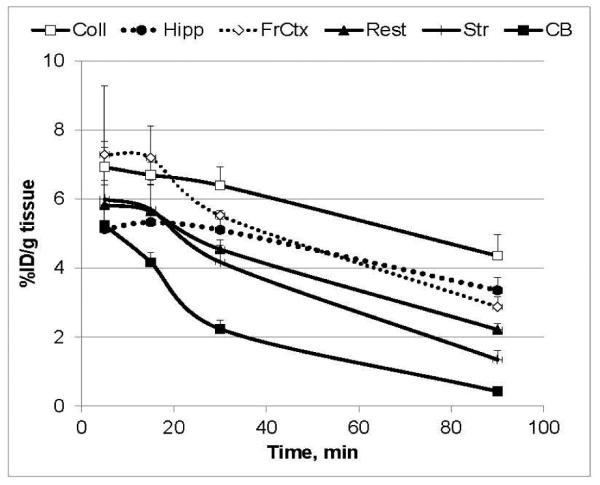
Fig. 6.

Regional distribution of [18F]ASEM in CD-1 mice. Data: mean %injected dose/g tissue ± SD (n = 3). Abbreviations: Coll = superior and inferior colliculus; Hipp = hippocampus; FrCtx = frontal cortex; Rest = rest of brain; Str = striatum; CB = cerebellum. Reprinted from [48] with permission of Copyright Clearance Center's RightsLink service. The study demonstrated that [18F]ASEM exhibits high brain uptake with regional distribution that matches the distribution of the α7-nAChR in the rodent brain and reversible brain kinetics.
