
Figure 3.
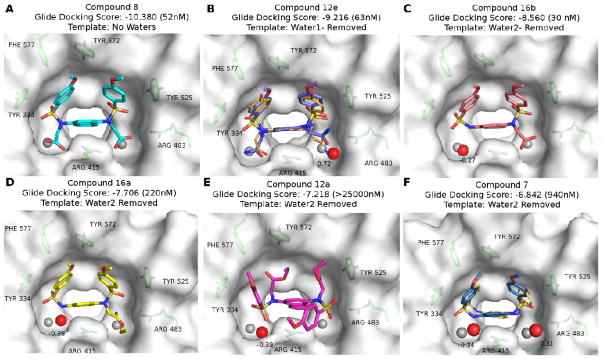
Docking and WATsite results for compounds (A) 8, (B) 12e, (C) 16b, (D) 16a, (E) 12a and (F) 7. For each molecule, the Glide docking score is shown, and the measured IC50 is noted in parentheses. The template selected by the ensemble docking procedure is shown below the docking score for each compound. The locations of the waters (shown as red spheres in Figure 2A) in the crystal structure 4IQK are shown as grey spheres in each frame. High occupancy (>80%) hydration sites predicted by WATsite that were within 2.0 Å of crystal waters are shown as red spheres. The ΔG of the hydration sites are shown in kcal/mol next to each site; a negative value indicates a favorable hydration site, and a positive value indicates an unfavorable site. The crystal structures of compound 12e (PDB: 4XMB; Panel B) and 7 (PDB: 4IQK; panel F) are shown in smaller orange sticks.