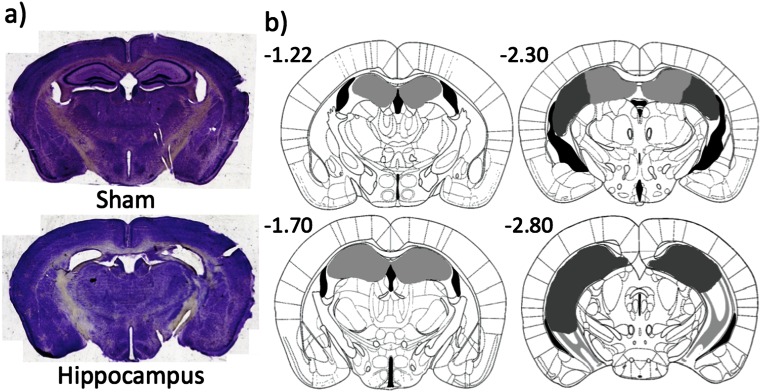
Fig. 3.
Photographs of representative sections and diagram of the extent of dorsal hippocampal lesions. a Photographs of coronal sections corresponding to −1.7 mm from bregma; b light grey represents the smallest lesion and dark grey represents the largest. All numbers correspond to distance in millimetre from bregma

