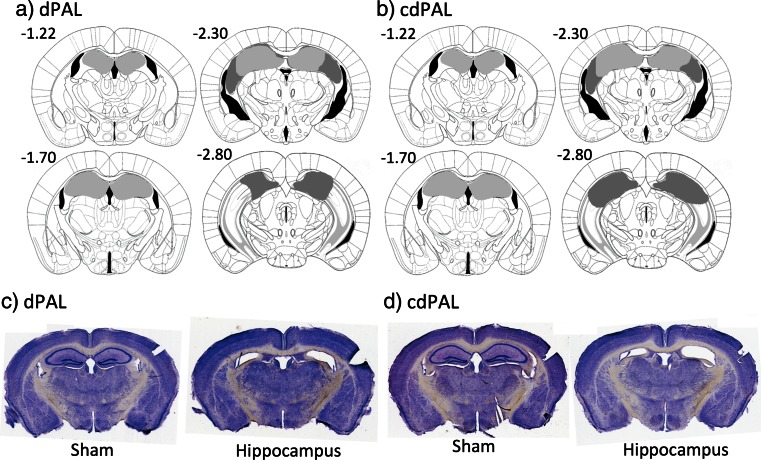
Fig. 4.
Diagram of the extent of hippocampal lesions and photographs of representative coronal sections. For a dPAL and b cdPAL, light grey represents the smallest lesion and dark grey represents the largest. All numbers correspond to distance in millimetre from bregma. Photographs of representative sections corresponding to −1.7 mm from bregma are shown for c dPAL and d cdPAL

