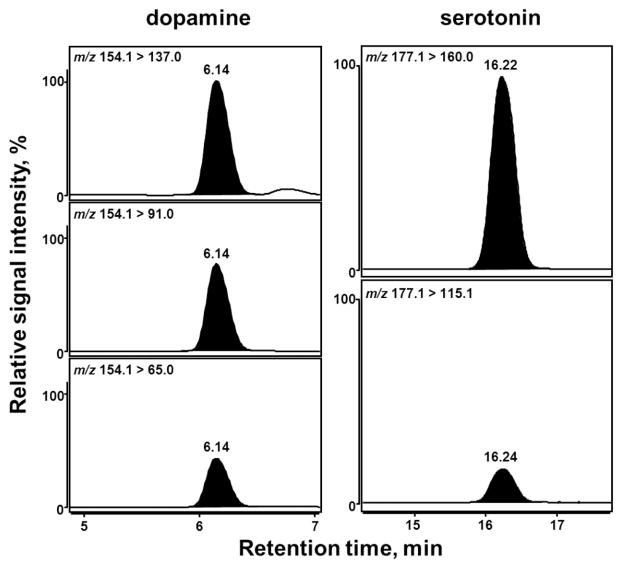
Figure 1.
MRM chromatograms of DA and SRT in a C. elegans homogenate. Three mass transitions were recorded for DA (left panel) whereas two mass transitions were optimized for the detection of SRT (right panel). Signal intensities of the qualifier transitions were scaled in relation to the respective quantifier transition (topmost chromatograms) that was set to 100%. The optimal collision energies for each depicted MRM transition are given in Table 1.

