Figure 3.
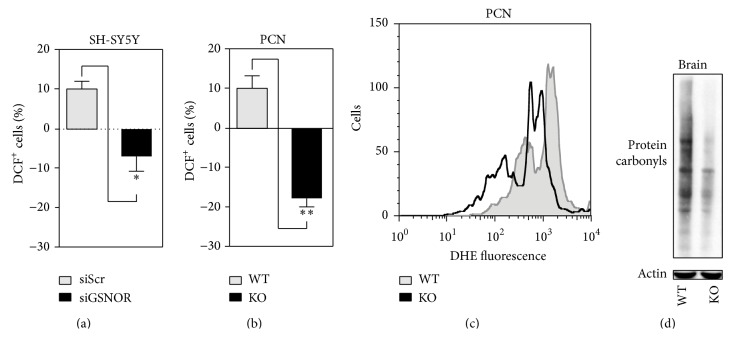
ROS production and protein carbonylation in GSNOR-downregulating systems. (a) Cytofluorimetric analyses of H2O2 in siScr and siGSNOR SH-SY5Y cells upon 2′,7′-dihydrodichlorofluorescein (DCF) staining. (b) Cytofluorimetric analyses of H2O2 and O2 •− in GSNOR-KO and WT PCN upon 2′,7′-dihydrodichlorofluorescein (DCF) or (c) dihydroethidine (DHE) staining. (d) Western blot analyses of protein carbonyls from mesencephalon obtained from GSNOR-KO and WT brains. Western blots shown are representative of at least n = 3 independent experiments that gave similar results. Actin was selected as loading control. Graphs shown represent the mean of data ± SD of n = 3 independent experiments, ∗ P < 0.05 and ∗∗ P < 0.01.

