Figure 5.
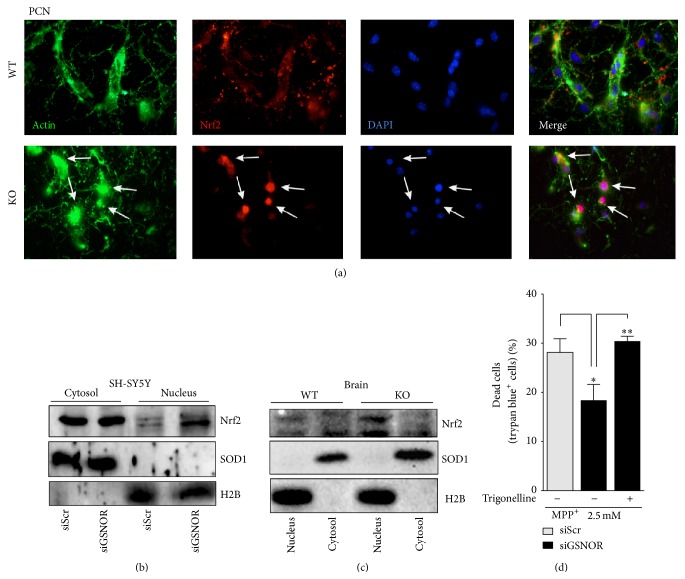
Nuclear localization of Nrf2 in GSNOR-downregulating systems. (a) Fluorescence microscopy analyses of WT and GSNOR-KO PCN upon staining with anti-Nrf2 antibody (red), phalloidin (green), and Hoechst 33342 (blue), with the last two probes used to selectively highlight actin (cytoskeleton) and nuclei, respectively. Western blot analyses of Nrf2 in nuclear and cytosolic fractions obtained from (b) siScr and siGSNOR SH-SY5Y cells or (c) GSNOR-KO and WT brains. Western blots shown are representative of at least n = 3 independent experiments that gave similar results. SOD1 and histone 2B (H2B) were selected as loading and purity controls of cytosol and nuclei, respectively. (d) Direct cell count upon Trypan blue staining of siScr and siGSNOR SH-SY5Y cells treated for 24 h with 2.5 mM MPP+ in the presence or absence of 1 mM of the Nrf2 pharmacological inhibitor trigonelline. Graphs shown represent the mean of data ± SD of n = 3 independent experiments, ∗ P < 0.05 and ∗∗ P < 0.01.

