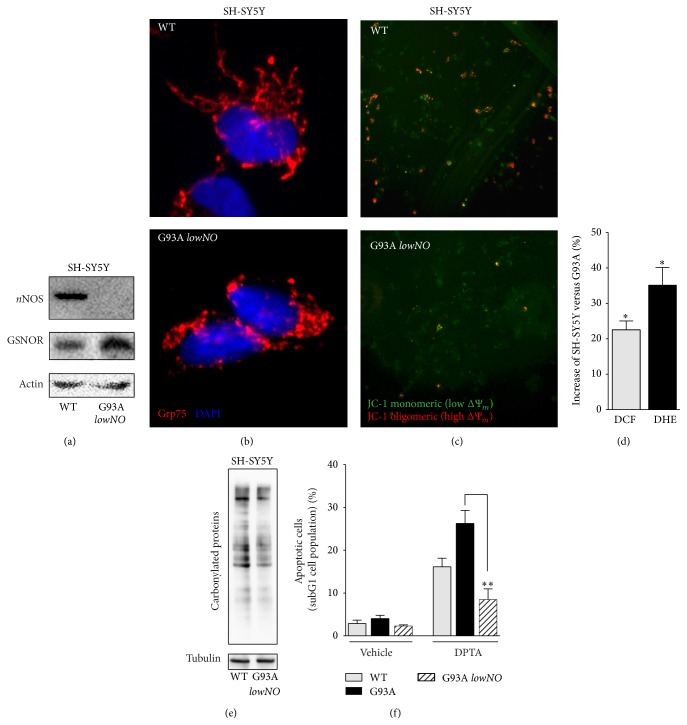
Figure 7.
Characterization of the lowNO G93A resistant clone. (a) Western blotting of nNOS and GSNOR in total cell lysates of parental SH-SY5Y (WT) and the resistant lowNO G93A clone. (b) Fluorescence microscopy analyses of parental SH-SY5Y (WT) and the lowNO G93A clone. Anti-Grp75 (red) and Hoechst 33342 were used to visualize mitochondria and nuclei, respectively. (c) Fluorescence microscopy analyses of mitochondrial transmembrane potential (Δψ m) of WT and the lowNO G93A clone by JC-1. Red fluorescence, high Δψ m and green fluorescence, low Δψ m. (d) Cytofluorimetric analyses of H2O2 and O2 •− in SH-SY5Y (WT) and the lowNO G93A clone upon 2′,7′-dihydrodichlorofluorescein (DCF) or (c) dihydroethidine (DHE) staining. (e) Western blot analyses of protein carbonyls from total cell lysates obtained from WT and the lowNO G93A clone. (f) Cytofluorimetric analyses of apoptosis upon propidium iodide staining performed on parental SH-SY5Y cells (WT), sensitive G93A, and the lowNO G93A clone treated for 24 h with 400 μM DPTA. Western blots shown are representative of at least n = 3 independent experiments that gave similar results. Actin or tubulin was selected as loading controls. Graphs shown represent the mean of data ± SD of n = 3 independent experiments, ∗ P < 0.05 with respect to trigonelline untreated cells.

