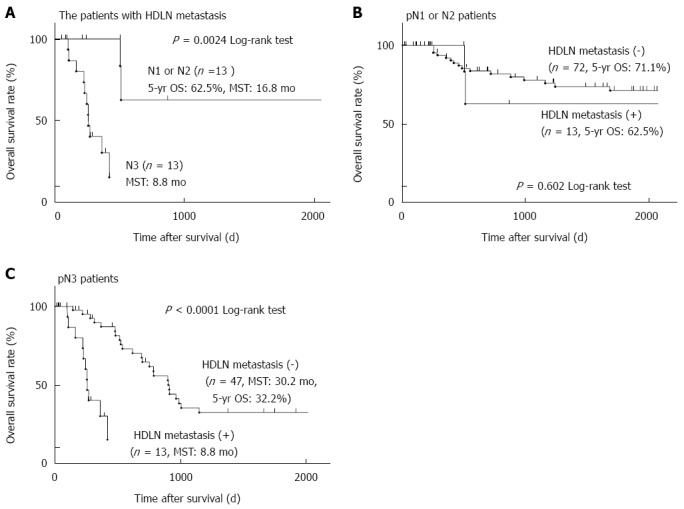
Figure 2.

Five-year overall survival curves of gastric cancer patients based on the extent of lymph node metastasis. A: Twenty-six patients who had hepatoduodenal lymph node (HDLN) metastasis were divided into two groups based on the extent of lymph node metastasis. A group of pathological (p)N1 or N2 (n = 10) and that of pN3 (n = 16) were compared as described in Figure 1 (P = 0.0024); B: All 82 pN1 or N2 patients were divided into two groups based on HDLN metastasis and analysed as described in Figure 1 (10 patients with HDLN metastasis and 72 patients without HDLN metastasis, P = 0.602); C: All 63 pN3 patients were analysed as described in Figure 1 (16 patients with HDLN metastasis and 47 patients without HDLN metastasis, P < 0.0001).
