FIG. 6.
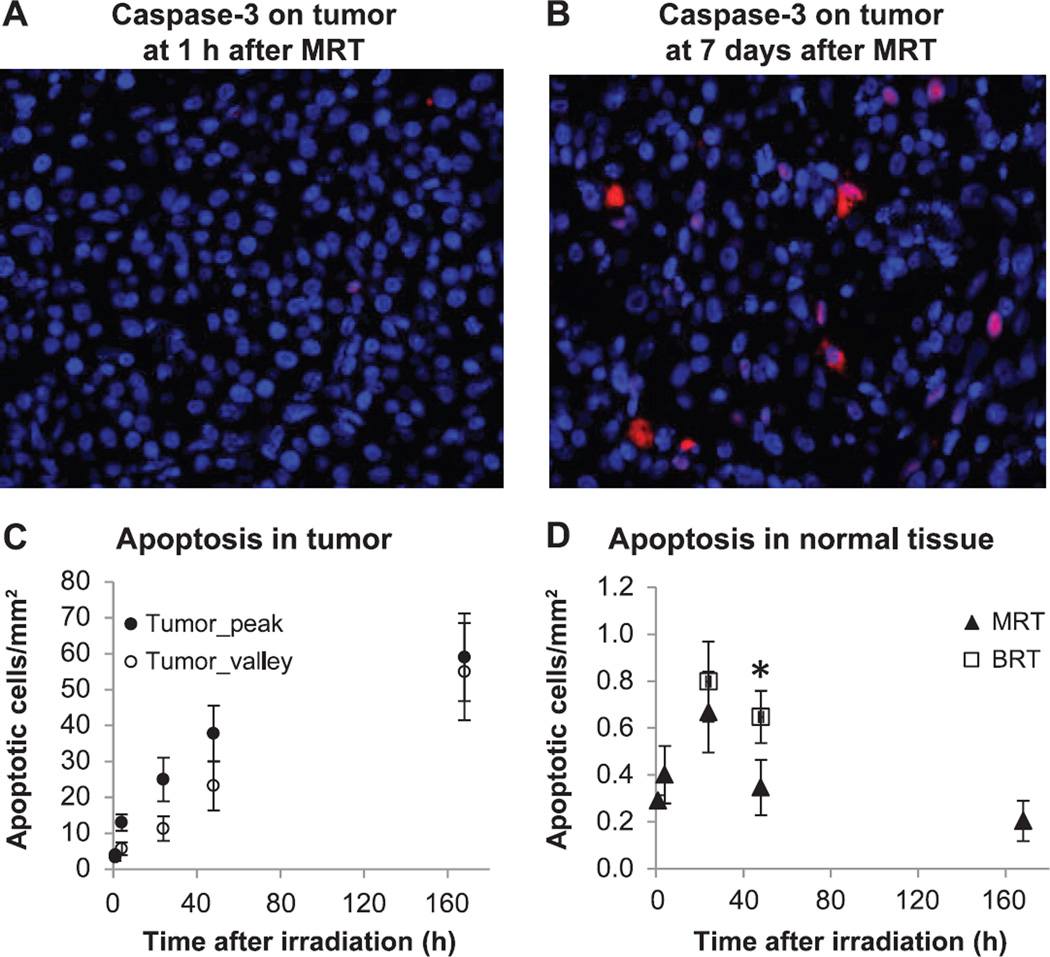
Immunofluorescence staining of cleaved caspase-3 as cell apoptosis assay. Cleaved caspase-3 signal is shown in red fluorescence. Red: positively stained cleaved caspase-3 signal; blue: DAPI counterstaining of the nuclei. Panel A: Low level of apoptosis at 1 h after MRT in tumor tissue. Panel B: Apoptotic cells at day 7 after MRT in tumor tissue. Panel C: Number of apoptotic cells from 1 h to day 7 after MRT in tumor tissue. There were significant differences between the peak and valley regions at 4 and 24 h, but not at 48 h and day 7 after MRT. Panel D: Number of apoptotic cells in the contralateral normal brain tissue after MRT and at 24 and 48 h after BRT. There was a significantly higher level of apoptosis at 48 h after BRT (*P < 0.05, compared to MRT).

