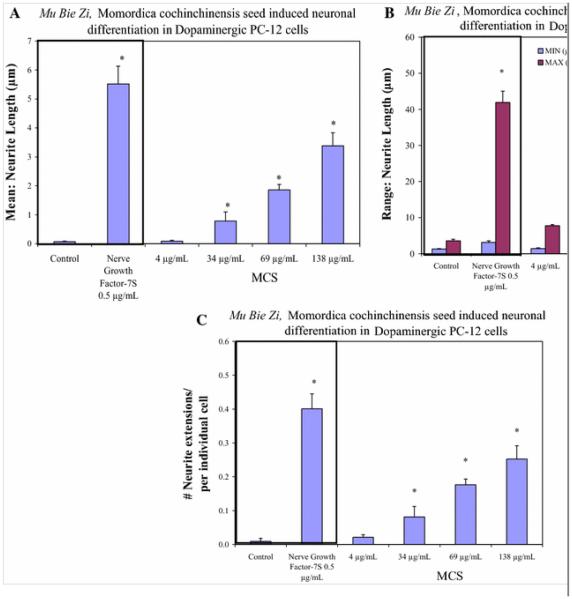
Fig. 2.
a Effects of MCS relative to NGF on neurite extension length in PC12 cells at 7 days. The data represent average neurite length (microns) and are expressed as the mean ± SEM, n = 6 images. Significant differences from the control were evaluated using a one-way ANOVA, with a Tukey post hoc test, *P < 0.05. b Effects of MCS relative to NGF on neurite minimum and maximum neurite length in PC12 cells at 7 days. The data represent average Min. or Max. (microns) and are expressed as the mean ± SEM, n = 6 images. Significant differences from the control were evaluated using a one-way ANOVA, with a Tukey post hoc test, *P < 0.05. c Effects of MCS relative to NGF on neurite outgrowth in PC12 cells at 7 days. The data represent average # neurites/# cells per image—and are expressed as the mean ± SEM, n = 6 images. Significant differences from the control were evaluated using a one-way ANOVA, with a Tukey post hoc test, *P < 0.05

