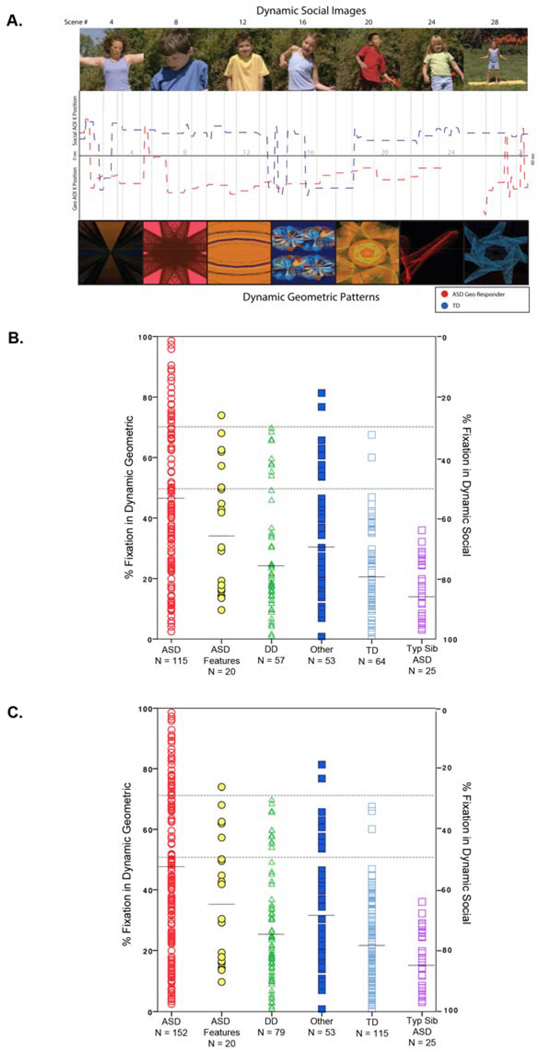
Figure 1.
(A) Sample social and geometric scenes from the 1-minute 28-scene) GeoPref Test. Visual scanning data (X-axis fixation points) from a typically developing toddler (blue line) and an ASD Geometric Responder toddler (red line) are plotted across time. Breaks in the line represent a lack of fixation towards the movie. (B) Scatterplot of the independent group (N=334) illustrating the percentage of fixation time to both DGI and DSI for each toddler across each diagnostic group. Total percent time viewing DGI and DSI sums to 100% for each toddler. For example, a toddler who spends 80% viewing time on geometric images (as noted on the Y axis on the left) thus spends 20% viewing time on social images (as noted on the Y axis on the right). A toddler who spends >50% viewing geometric images is considered a “geometric responder” and a toddler who spends >50% viewing social images is considered a “social responder.” (C) Scatter plot of the combined group (N=444).

