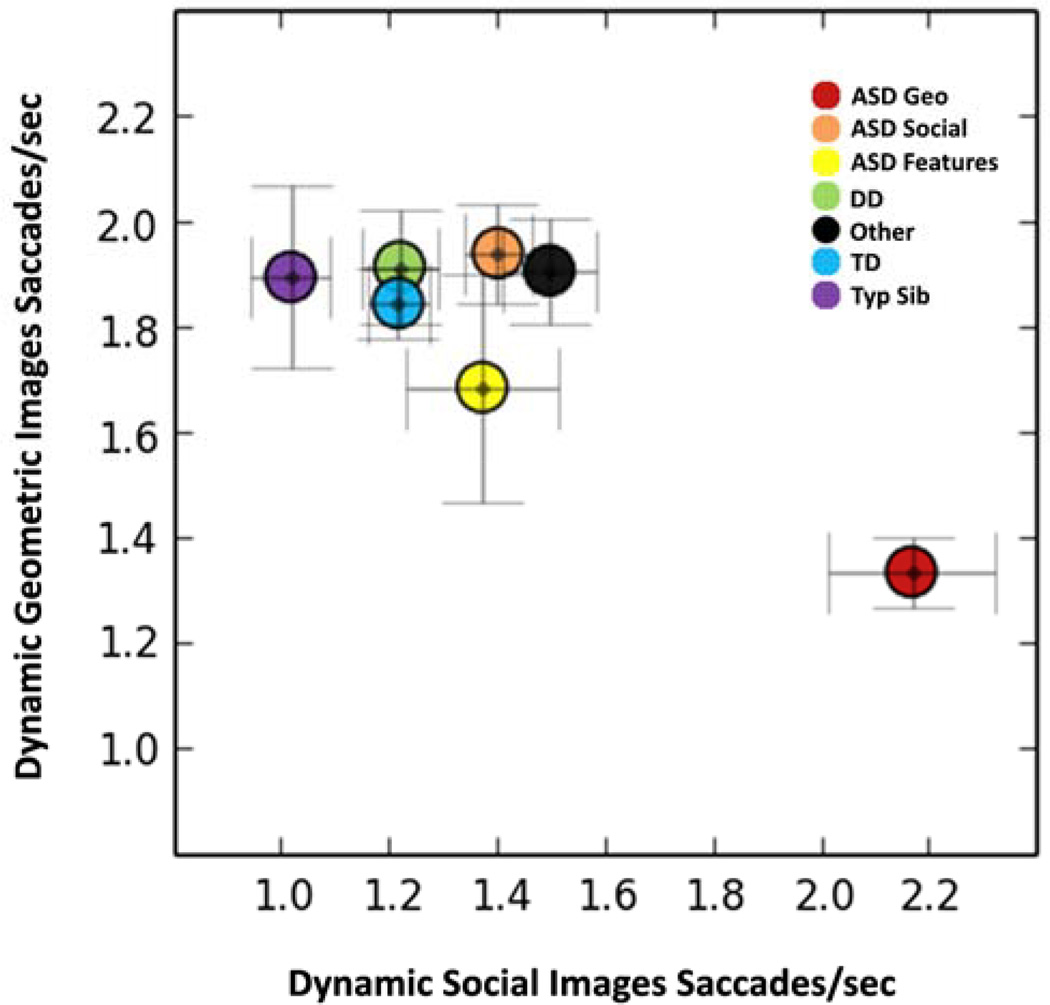
Figure 5.
Plot illustrating the average number of saccades per second when toddlers were viewing DGI or DSI for each diagnostic group. Toddlers with ASD that displayed a “Geometric Responder” profile were plotted separately from toddlers with ASD that displayed a “Social Responder” profile. The ASD Geometric Responder toddlers (red circle, bottom right of graph) displayed a unique saccade pattern that included fewer saccades when fixating on geometric shapes, but greater saccades when viewing social images. Error bars represent standard error of the mean. Dynamic Geometric Image Saccades/sec means±standard errors for groups are: ASD Geo: 1.33±0.07, ASD Soc: 1.94±0.09, ASD Features: 1.68±0.22, DD: 1.91±0.11, Other: 1.91±0.10, TD: 1.86±0.07, and Typ Sib: 1.89±0.17. Dynamic Social Image Saccades/sec means±standard errors for groups are: ASD Geo: 2.17±0.16, ASD Soc: 1.40±0.06, ASD Features: 1.37±0.14, DD: 1.22±0.07, Other: 1.50±0.09, TD: 1.22±0.06, and Typ Sib: 1.02±0.07.

