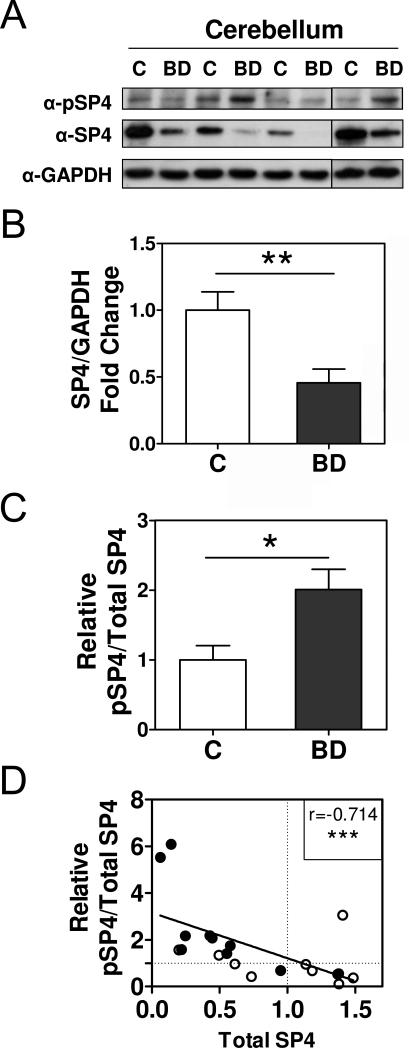
Figure 2. Increased phospho-SP4 S770 in the postmortem cerebellum of bipolar disorder patients.
Levels of phospho-SP4 S770 (pSP4), total SP4, and GAPDH were determined in protein extracts from cerebellar postmortem tissue of control (C) and bipolar disorder (BD) individuals. A. Images show representative pSP4, SP4, and GAPDH immunoblots from four control individuals (C) and four BD subjects (BD). B. The graph shows the mean and standard error of the mean of SP4 normalized to GAPDH for control and BD individuals from two independent analyses. Statistical analysis was performed using unpaired t test. C. The graph shows the mean and standard error of the mean of the ratio of pSP4 and total SP4 for control and BD individuals from two independent analyses. Statistical analysis was performed using the Mann-Whitney test. D. The graph shows the correlation between the ratio of pSP4 and total SP4 of control (open symbols) and bipolar disorder subjects (closed symbols). Both variables were normalized to the mean of the control group which is labeled with a dotted line for both axes. The solid line is adjusted to a linear regression of the values. Each value represents the mean of two independent analyses. The uncorrected Spearman coefficient r is shown in the graph. Corrected Spearman coefficient after exclusion of two outliers detected by Peirce's criterion was: Spearman's r= −0.610; 95%CI (−0.8426, −0.1855), p=0.0072, n=18. (*p<0.05, **p<0.01, *** p<0.001).

