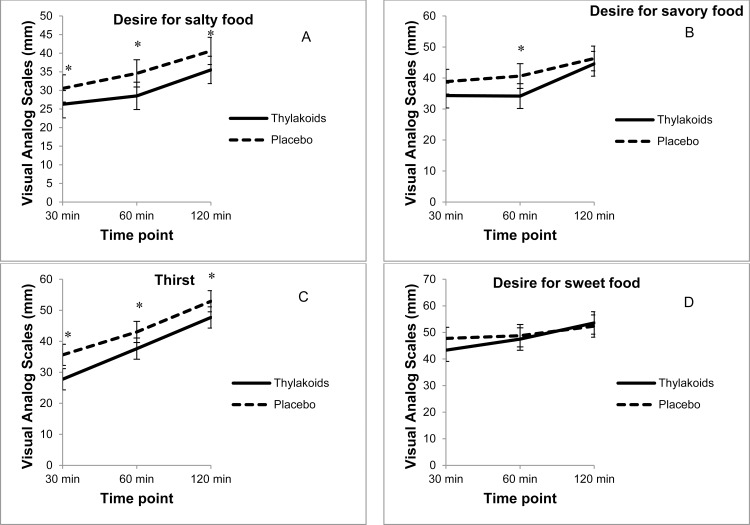
Fig. 2.
Visual analog scale ratings for satiety (n = 59) over 2 hours after consuming the spinach extract or a placebo. Values are mean ± standard error. (A) Desire for salty food: overall differences, 5.14 mm ± 1.09 (p < 0.01), *30 minutes (p = 0.02), *60 minutes (p < 0.01), and *120 minutes (p < 0.01). (B) Desire for savory food: overall differences, 4.22 mm ± 1.4 (p < 0.01) *60 minutes (p < 0.01). (C) Desire for sweet food: overall differences were not significant. (D) Thirst: overall differences, 6.16 mm ± 1.46 (p < 0.01) *30 minutes (p < 0.01), *60 minutes (p = 0.03), and *120 minutes (p = 0.04).

