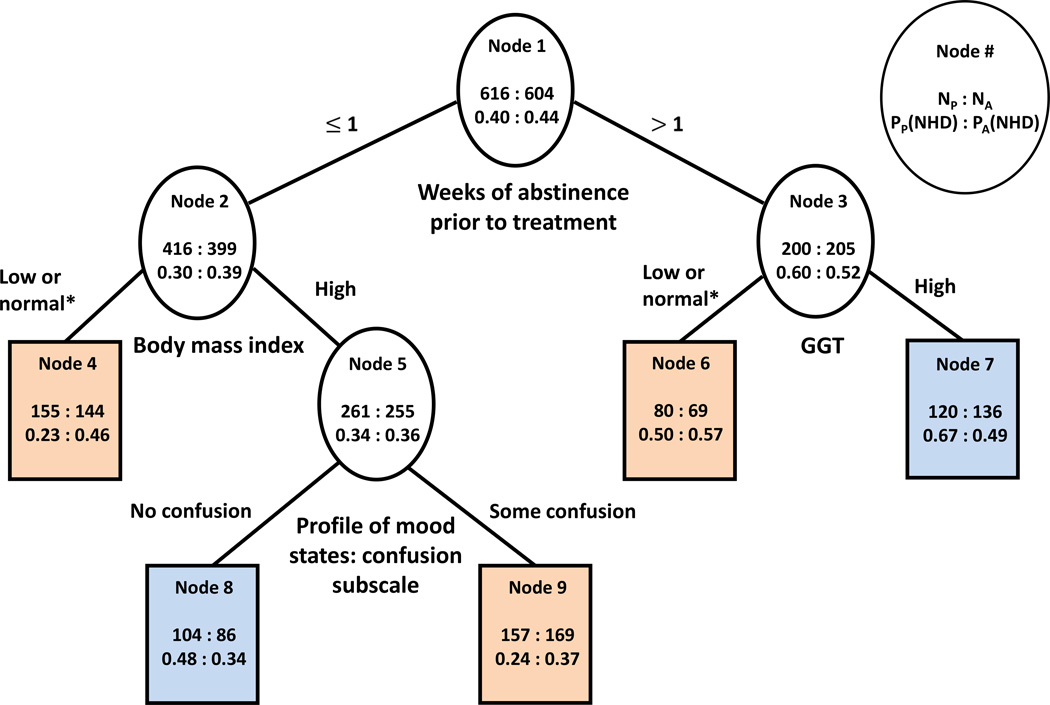
Figure 1.
Classification tree built using the approach of Zhang et al. (2010).
*Low or normal means within the normal range or below the lower limit of the normal range.
Terminal nodes in orange denote better outcome on acamprosate while terminal nodes in blue denote worse outcome on acamprosate than on placebo.
NA: Number of participants on acamprosate; NP: Number of participants on placebo; PA(NHD): Proportion of participants with no heavy drinking during the last 8 weeks of treatment on acamprosate; PP(NHD): Proportion of participants with no heavy drinking during the last 8 weeks of treatment on acamprosate

