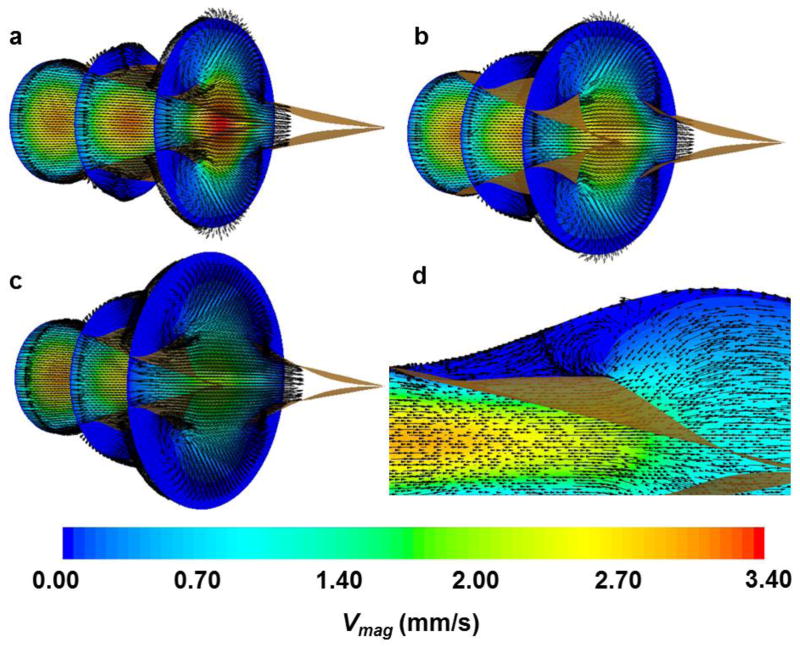
Figure 6. Cross-sections of velocity obtained during Step III (vectors and contours show velocity direction and magnitude, respectively).
(a) STR = 1.42; (b) STR = 1.60; (c) STR = 2.05; (d) STR = 2.05. Note that velocity vectors are prescribed as constant length rather than proportional to velocity to better illustrate the flow patterns. A view of the sinus and valve leaflets is enhanced in (d) to better illustrate regions of apparent recirculation above the valve leaflets.

