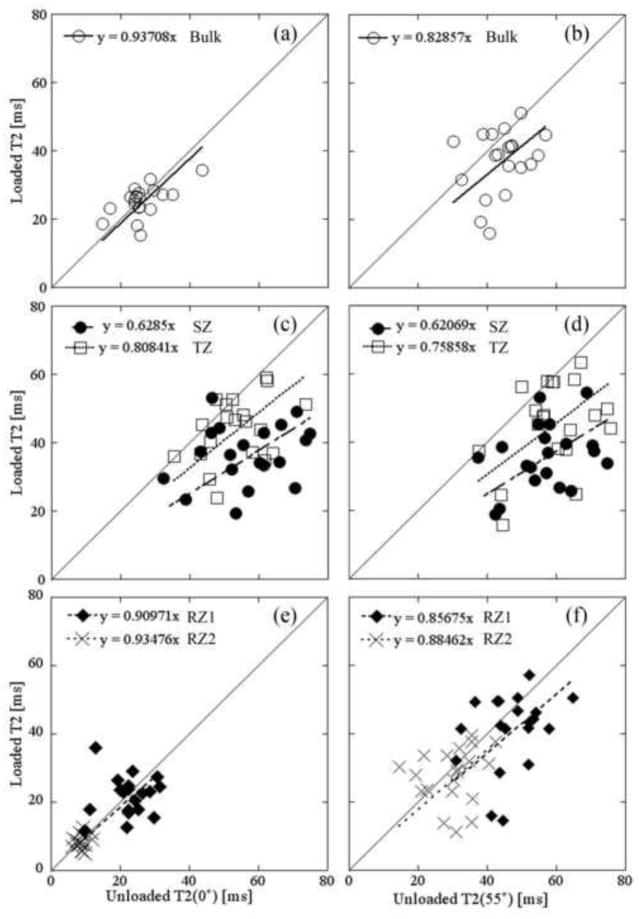
Figure 3.
A representative set of the paired and averaged T2 data at 0° (left) and 55° (right) before and after loading with linear regression in bulk (a, b), SZ and TZ (c, d), and RZ1 and RZ2 (e, f) from the meniscus-covered regions of 8X specimens. Each data point represents the averaged zonal T2 value both before (horizontal) and after loading (vertical) of the same specimen. The solid line has a slope of 1. The slopes of linear fit less than one indicates the T2 values decreased with loading.

