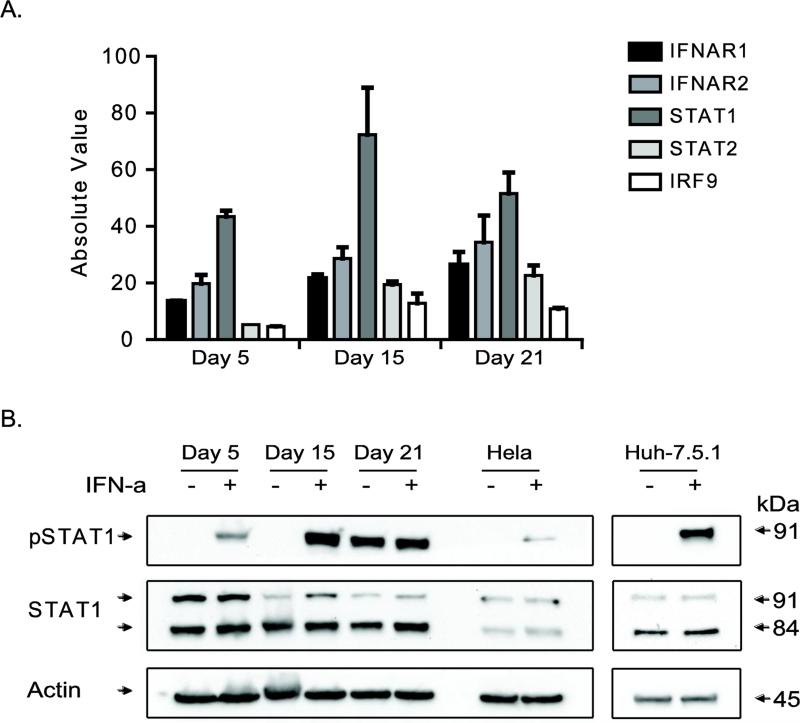
Figure 3.
Analysis of JAK/STAT1 pathway in differentiating cells. (A) Basal expression values of factors involved in mediating the IFN-signaling pathway are given in the bar graph. The absolute expression values were obtained from RNA-seq data of differentiating cells (without IFN-α treatment). (B) Analysis of STAT1 upon IFN-α treatment. Phosphorylated STAT1 (Tyr701) was detected following IFN-α addition to differentiating cells. Total STAT1 and actin was included as a loading control. HeLa cells and Huh-7.5.1 cells with or without IFN-α treatment were included as positive control. Note that the day 21 untreated cells have higher basal levels of pSTAT1.

