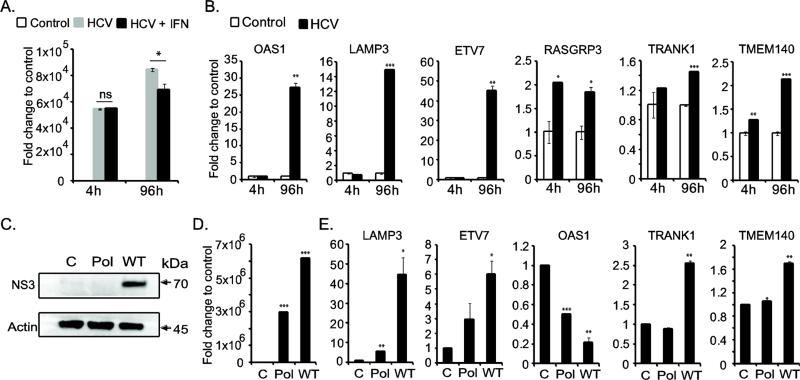
Figure 7.
Functional validation of ISGs during hepatitis C virus replication. (A) HCV genome level was quantified by RT-qPCR. 4 hour time point indicates the equal amount of transfected RNA in IFN-α untreated (HCV) and treated (HCV-IFN) cells. At 96 hour-post transfection, the HCV replication was enhanced, but was inhibited in IFN-α treated cells. (B) HCV replication resulting in upregulation of ISGs. (C) Western blot analysis of HCV NS3 protein production during viral replication. Protein lysates from mock transfected control cells, as well as HCV polymerase null (Pol) and HCV wild type (WT) genomic RNA transfected cells at 96 hour post-transfection were used. β-actin was included as loading control. (D) HCV replication level in Huh-7.5.1 cells is presented in the bar graph. The cells were transfected with 1 μg of viral genomic RNA. At 96 hour-post transfection, the HCV genome level was quantified and the fold change was calculated to that of control cells (mock transfected). (E) The ISGs induced in Huh-7.5.1 cells upon HCV replication at 96 hour-post transfection are shown in the bar graph.

