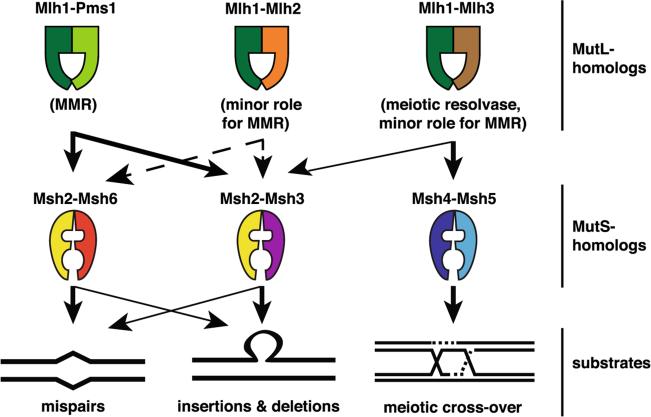
Fig. 1.
S. cerevisiae MSH and MLH complexes. The arrows indicate their functional interactions and potential functions in vivo. Arrows denote major roles (thick arrows) and minor roles (thin arrows) in the indicated processes. Dashed lanes represent interactions that are biologically relevant apparently only in specific genetic backgrounds

