
Figure 2.
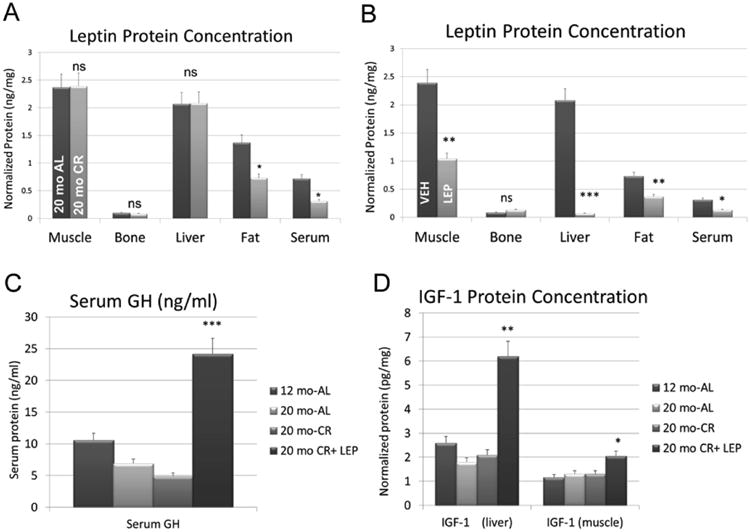
ELISA data for leptin, growth hormone (GH) and IGF-1. Data are shown for A. leptin levels in peripheral tissues and serum of aged mice fed ad libitum (AL) and on calorie restriction (CR), B. leptin levels in peripheral tissues and serum in aged, CR mice receiving saline (VEH) and receiving leptin (LEP), C. serum levels of growth hormone (GH) in mice fed ad libitum (AL), on caloric restriction (CR), and calorie-restricted treated with leptin (CR + Lep), and D. IGF-1 in tissues of mice fed ad libitum (AL), on caloric restriction (CR), and calorie-restricted treated with leptin (CR + Lep). Vertical bars represent group means and error bars are the standard error. *P<.05,** P<.01,***P<.001, ns=non-significant.