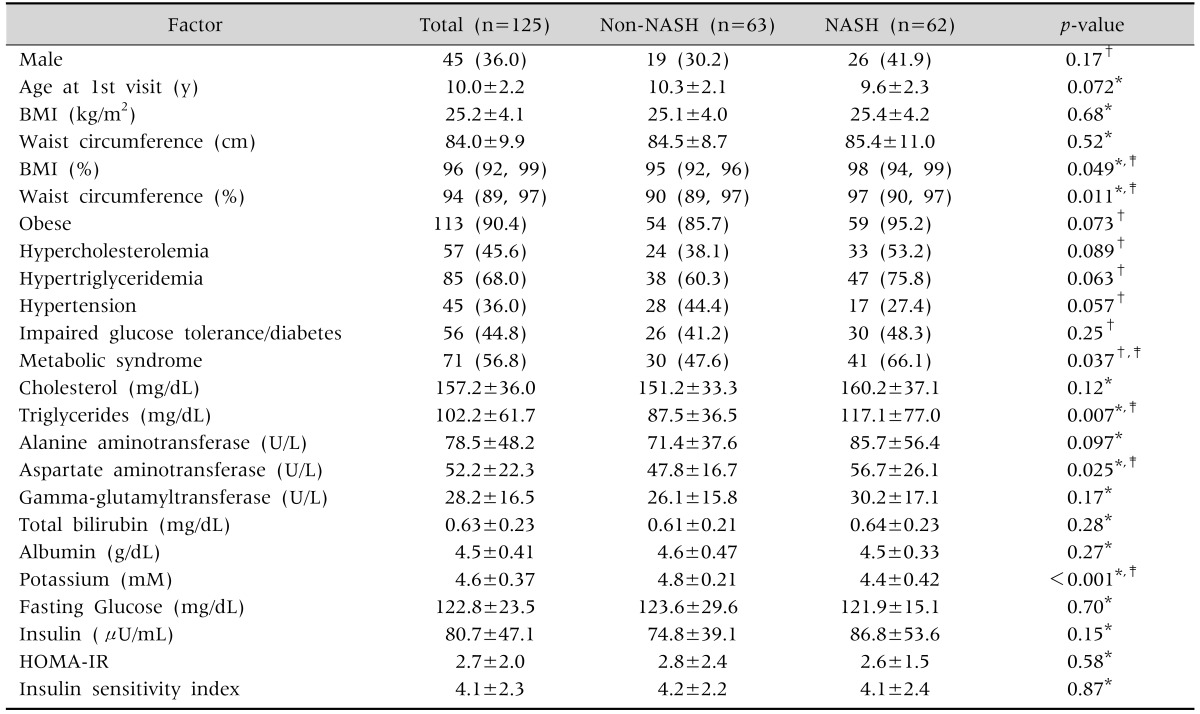
Table 1. Demographic and Clinical Characteristics.

Values presented as number (%), mean±standard deviation, or median (25th, 75th percentiles).
NASH: nonalcoholic steatohepatitis, BMI: body mass index, HOMA-IR: homeostasis model assessment index of insulin resistance.
*ANOVA, †Pearson's chi-square test, ‡p-values are statistically significant.
