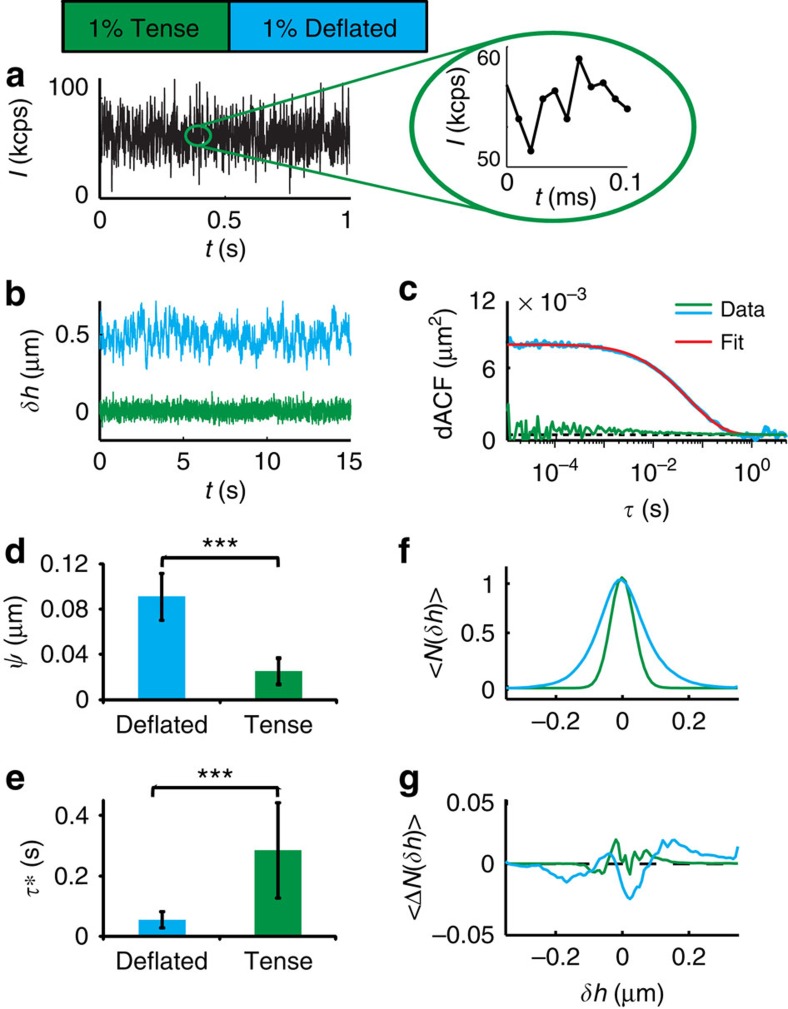
Figure 3. DODS validation and application to GUVs.
(a) A typical intensity trace recorded at IP (inset: zoom). (b) Displacement trace, δh, for tense and deflated GUV (the latter is shifted by +0.5 μm for clarity) and (c) corresponding dACF. Fitting of dACF (red line) yields the fluctuation amplitude,  , and the relaxation time, τ*, which define the membrane tension and the viscosity of the surrounding medium (see text for details). (d)
  and (e) τ* for deflated and tense GUVs. Significance levels, P, were evaluated by Mann–Whitney U-test: P<0.001 (***), P<0.01 (**) and P<0.05 (*). Error bars denote s.d. of results. (f) Histogram of membrane fluctuations, 〈N(δh)〉, and (g) deviation from a Gaussian fit, 〈ΔN(δh)〉. Data represent the average of all tense (N=10, 3 experiments) and deflated (N=46, 9 different experiments) vesicles, respectively.

