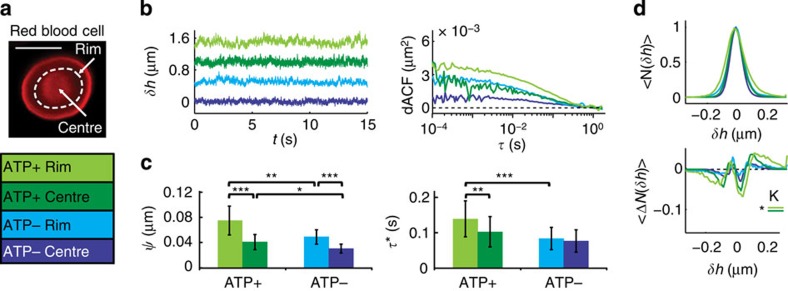
Figure 4. DODS applied to RBCs.
(a) Fluorescence image and measurement positions (white dashed lines) for a RBC, scale bar, 5 μm. (b) Displacement traces, δh, (shifted by +0.5 μm for clarity) and dACFs (rim/centre, ATP+/ATP−). (c) Fluctuation amplitude,  , and relaxation time, τ*. Error bars denote s.d. (d) Histogram of displacements, 〈N(δh)〉, and deviation from a Gaussian fit, 〈ΔN(δh)〉, averaged for all cells (seven different ATP+ experiments (rim: N=31, centre: N=24) and seven different ATP− experiments (rim: N=26, centre: N=18)). Significance levels for differences in skewness (S) and kurtosis (K) are indicated. Significance according to Mann–Whitney U-test P<0.001 (***), P<0.01 (**) and P<0.05 (*).

