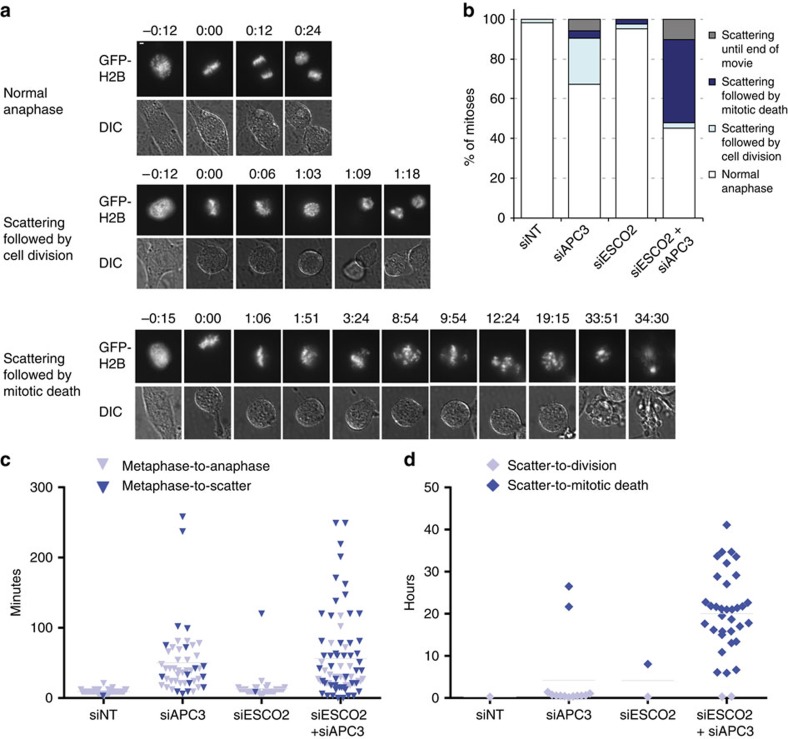
Figure 6. Severely prolonged mitosis with scattered chromosomes results in mitotic death.
RPE1 cells were imaged every 3 min for 48 h using time-lapse microscopy, starting two days after transfection with the indicated siRNAs. (a) Representative examples of the observed phenotypes ‘normal anaphase' (siESCO2), ‘scattering followed by cell division' (siAPC3) or ‘scattering followed by mitotic death' (siESCO2+siAPC3). Bar 5 μM. (b) Percentages of mitotic fates observed in the different conditions (siNT N=55, siAPC3 N=52, siESCO2 N=42, siESCO2+siAPC3 N=64). (c) Duration (in minutes) from the time of metaphase plate formation until either a normal anaphase or chromosome scattering was observed. (d) Duration (in hours) until the cells with scattered chromosomes (the dark blue cells in (c)) show either cell division or mitotic death.

