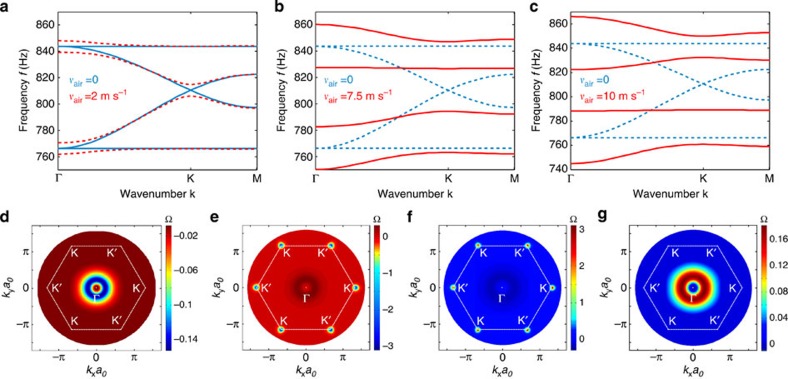
Figure 2. Bulk band structure with different levels of airflow.
(a–c) Band diagrams for bulk acoustic modes obtained using first-principle numerical calculations based on finite element method. (a) The blue solid lines show the case of the unbiased lattice, supporting a conventional Dirac point in the spectrum. Red dashed lines correspond to the case of slow air rotation inside the resonators. (b,c) Red solid lines show the band diagrams for special values of fluid velocity, inducing a vanishing group velocity for former top and bottom Dirac bands, respectively. For reference, the blue dashed lines refer to the stationary case, consistent with a. (d–g) Berry curvatures of the 1st, 2nd, 3rd and 4th bands, respectively, for angular momentum bias vair=2 m s−1.

