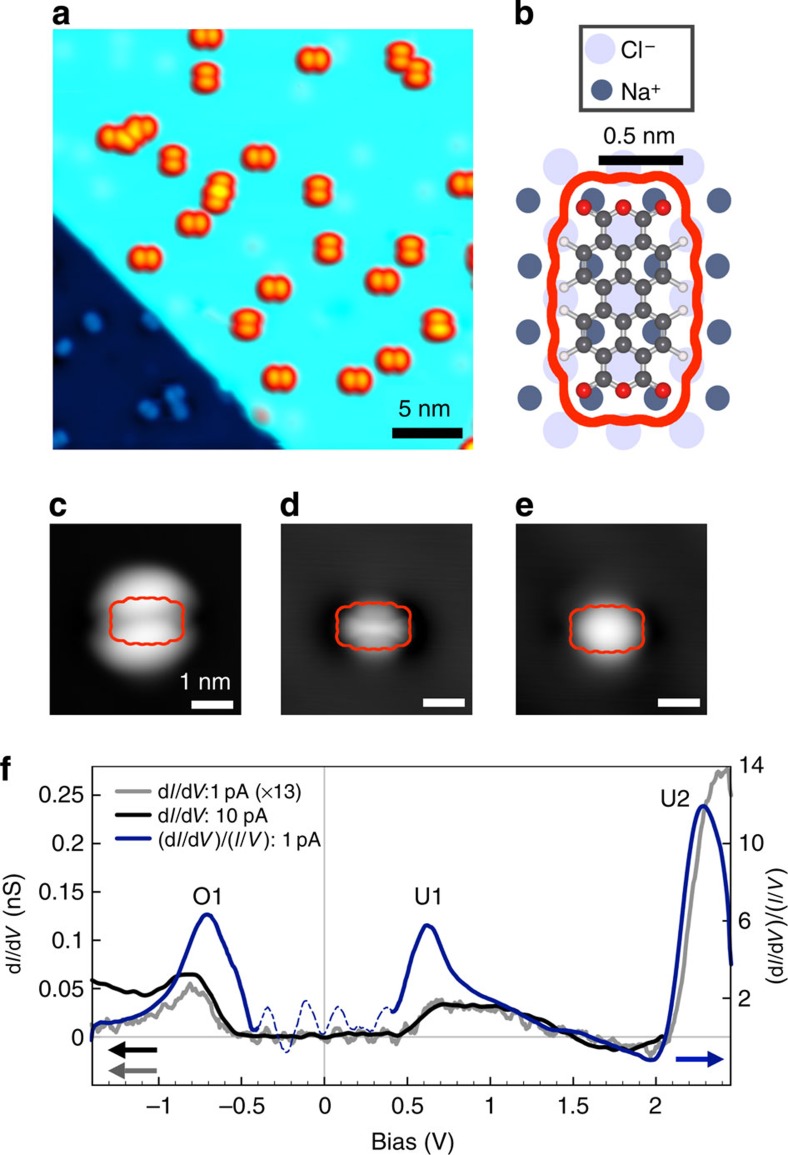
Figure 1. STM/STS of isolated PTCDA molecules on NaCl(2 ML)/Ag(111).
(a) STM constant-current image (30 × 30 nm2, I=30 pA, Vb=−1.5 V) of PTCDA adsorbed on NaCl(2 ML)/ Ag(111). (b) Adsorption geometry of PTCDA on the NaCl lattice. Electronic density isocontour (0.0004, eÅ−3) is outlined in orange (calculated in Gaussian using B3LYP unrestricted 6-31G). (c–e) STM images of an isolated PTCDA molecule at different bias voltages on NaCl (2 ML)/Ag(111) showing submolecular resolution (4 × 4 nm2, (c) I=50 pA, Vb=−1.5 V, (d) I=40 pA, Vb=+0.5 V and (e) I=40 pA, Vb=+1.0 V). (f) STS spectra of an isolated PTCDA molecule on NaCl (2 ML)/Ag(111) (I=1 pA and 10 pA at Vb=−1.5 V). The differential conductance (dI/dV) (rescaled by a factor of 13 for I=1 pA in grey) and normalized differential conductance (dI/dV)/(I/V) are shown (region near zero with divergences with dashed line). The Fermi energy EF corresponds to VB=0 V. Three electronic resonances are identified as O1, U1 and U2. Images and STS at 4.3 K.

