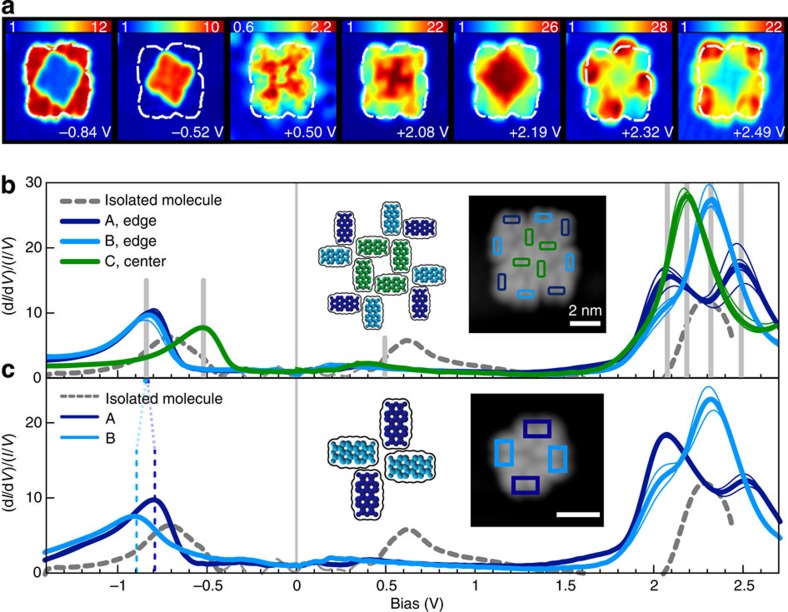
Figure 3. STS of PTCDA nanoislands.
(a) STS maps of a 12-molecule PTCDA island at increasing sample bias (8.5 × 8.5 nm2, Vb=−0.84, −0.52, +0.50, +2.08, +2.19, +2.49 V). Colour scales represent (dI/dV)/(I/V), dotted white line indicates outline of molecular cluster. (b) (dI/dV)/(I/V) spectra for molecule types A, B, C within the 12-molecule cluster (blue, cyan and green). Thick curves represent an average over all equivalent molecules. Thin curves are averaged over individual molecules. Grey vertical lines denote bias voltages of the STS maps in a. Inset: STM topographic scan taken during STS grid acquisition with spatially averaged spectra locations represented by coloured boxes (8.5 × 8.5 nm2, I=30 pA, Vb=−1.5 V). (c) (dI/dV)/(I/V) spectra of a four-molecule island. Inset: STM topographic scan (6 × 6 nm2, I=30 pA, Vb=−1.5 V).

