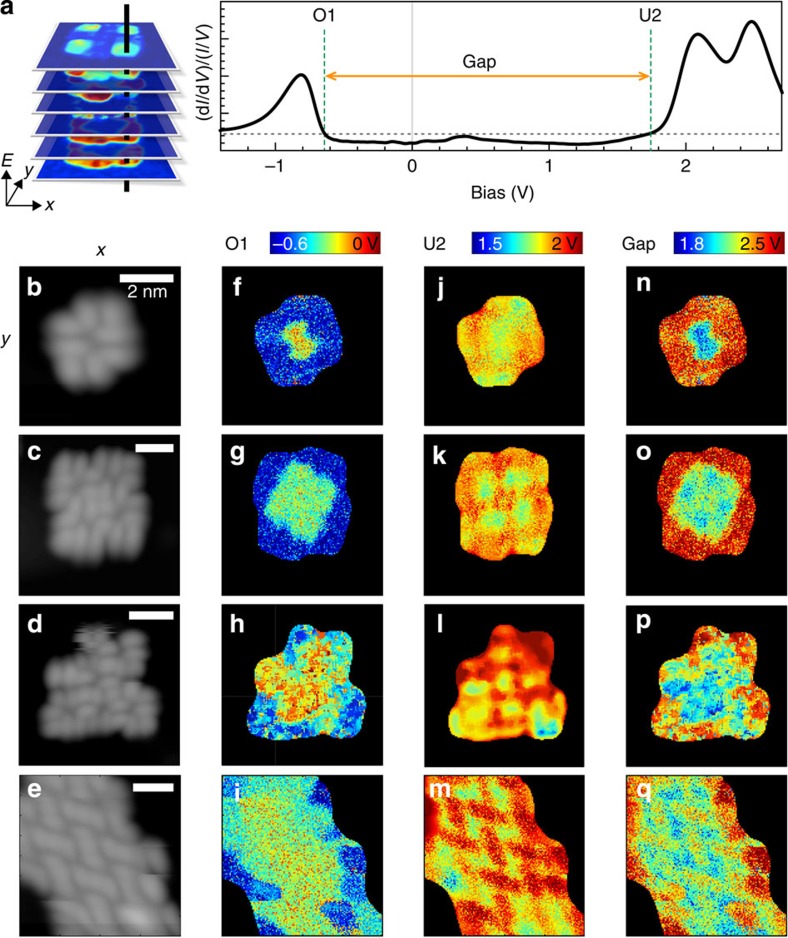
Figure 4. Local energy level alignment within PTCDA islands of different sizes.
(a) For each (dI/dV)/(I/V) spectrum acquired at a given tip position (x,y), ‘band edges' are defined as the voltage onsets ((dI/dV)/((I/V)=3)) of states O1 and U2. The band gap is the voltage difference between these onsets. (b–e) STM topographic images acquired during spectroscopic measurement for a 4-molecule, 12-molecule, 18-molecule island and herringbone nanoribbon, respectively (I=30 pA, Vb=−1.5 V, (b) 6 × 6 nm2, (c) 8.5 × 8.5 nm2, (d) 9.5 × 9.5 nm2, (e) 8 × 8 nm2). (f–i) 2D (x,y)-dependent maps of O1 voltage onset for (f) 4-molecule island, (g) 12-molecule island, (h) 18-molecule island and (i) herringbone nanoribbon. (j–m) Corresponding 2D (x,y)-dependent maps of voltage onset of U2. (n–q) Corresponding 2D (x,y)-dependent maps of band gaps.

