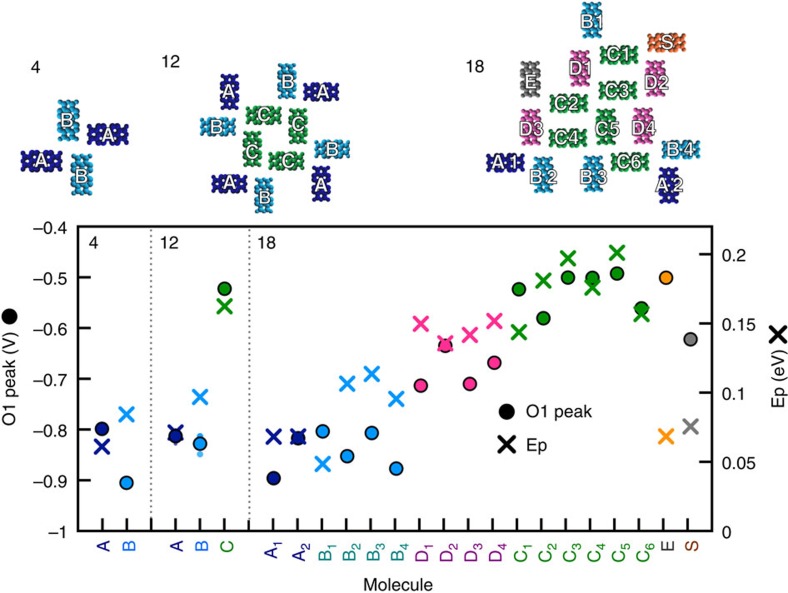
Figure 5. Occupied state of PTCDA islands with polarization energy.
The result of the microelectrostatic calculation (crosses) was plotted for each molecule in three islands: 4-molecule, 12-molecule and 18-molecule, and compared with the peak of the O1 state (dots). The specific molecules within the islands identified on the x axis are labelled in the schematic structure of each cluster above. The vertical axes for O1 and Ep differ by a factor of 2.8.

