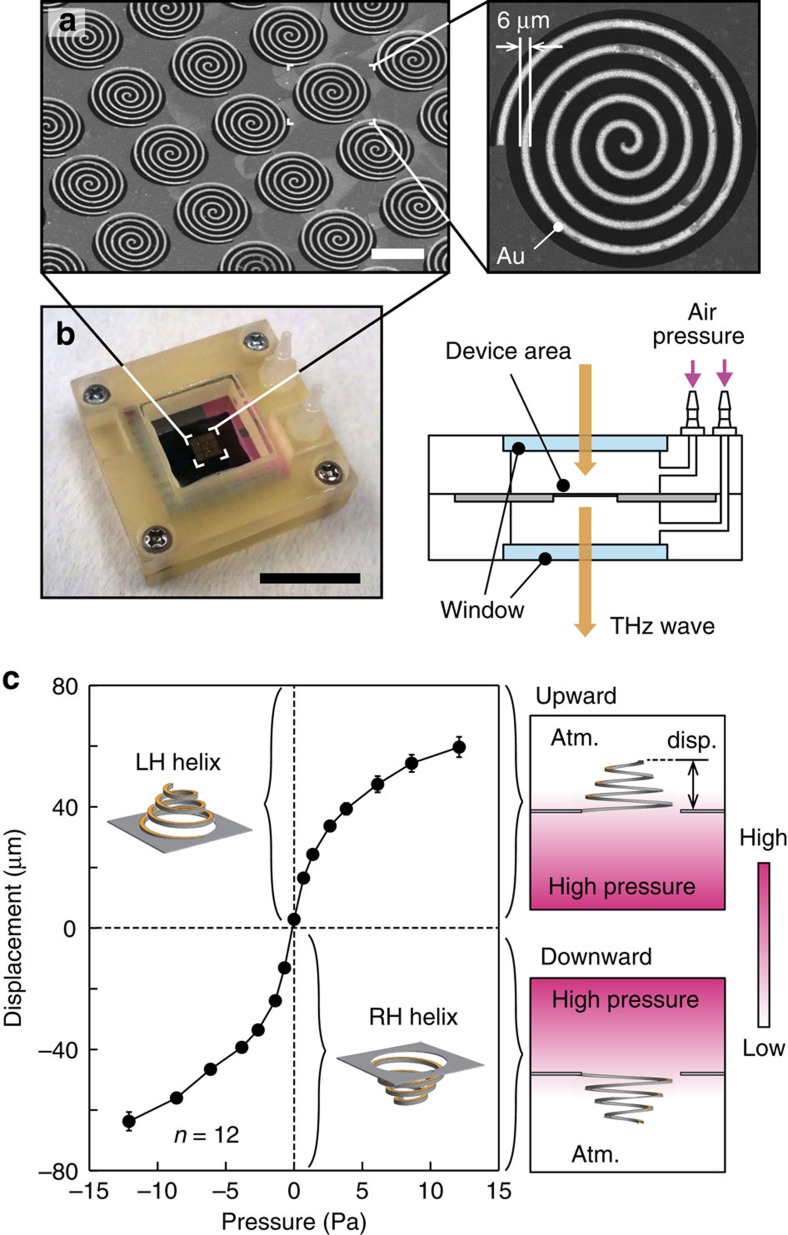
Figure 2. Scanning electron microscope (SEM) images and the actuation characteristics.
(a) SEM images of the spiral metamaterial with C1 symmetry. A bar indicates 100 μm. The right-side image shows a single spiral. (b) A photograph and a schematic diagram of the pressure application jig and the metamaterial chip (see also the Method section). A bar in the photograph indicates 20 mm. (c) Displacement of the spiral structure with respect to the applied pressure. The displacement was obtained at the spiral centre with a laser 3D profiler as N2 pressure was applied to the spirals (see also the Methods section and Supplementary Note 1 for detailed profiles and photographs, and a movie). The sign of the pressure is positive when the pressure is applied to the bottom chamber, resulting in LH spirals, and vice versa. The plotted points correspond to the average of 12 spiral deformations with error bars of s.d. The figures located to the right of the plot indicate the manner of pressure application for the upward or downward deformation directions (Atm., and disp. correspond to atmospheric pressure, and displacement.).

