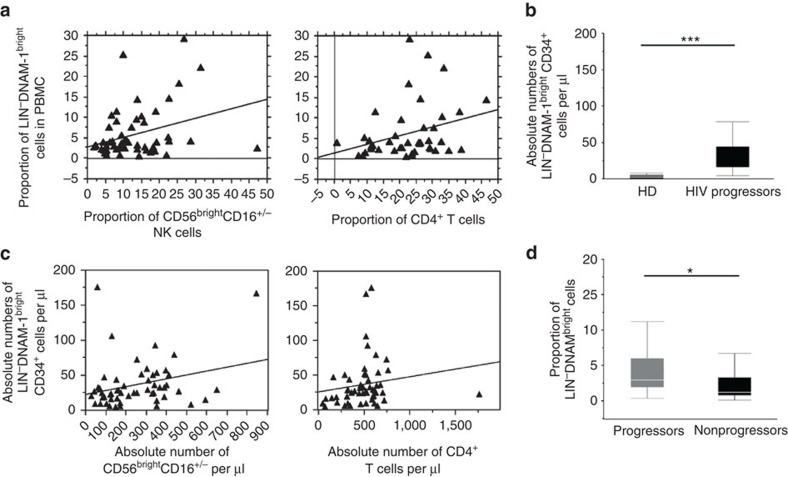
Figure 6. Analysis of Lin−CD34+DNAM-1bright PBMC by disease course.
(a) Correlation between the proportion of Lin−DNAMbright(CD34+) cells and CD56bright NK-cell subset and CD4 T cells in HIV patients. Correlation analysis among the proportion of Lin−DNAMbright cells, the proportion of CD4+ T cells and of CD56bright NK cells at the same time point in aviremic cART-treated patients (n°=60). Flow cytometric data were correlated by Spearman's ρ test. A direct correlation was detected for both CD4+ T and CD56bright NK cells *P<0.05. (b) Absolute numbers of circulating Lin−DNAMbright(CD34+) cells are increased in HIV-patient PBMC. Absolute numbers were derived from the proportion of Lin−DNAMbright(CD34+) cells and the absolute number of lymphocytes in complete blood counts on the same sample. Box-plots show increased numbers in patients with low to undetectable levels in HD (***P<0.001, Mann–Whitney U-test, 20 cART-treated progressors and 20 HD). (c) Correlation between the absolute numbers of Lin−DNAMbright(CD34+) cells and CD56bright NK-cell subset and CD4 T cells in HIV patients. Correlation analysis among the absolute numbers of Lin−DNAMbright cells, of CD4+ T cells and of CD56bright NK cells at the same time point in aviremic cART-treated patients (n°=60). Flow cytometric data were correlated by Spearman's ρ test. A direct correlation was detected for both CD4+ T and CD56bright NK cells, *P<0.05. (d) HIV-infected, cART-treated patients display increased circulating proportions of Lin−DNAMbright cells compared with spontaneous HIV controller patients. The proportion of DNAM-1brightCD56−(CD34+) cells on CD3−CD14−CD19−-gated PBMCs were determined by flow cytometry in spontaneous HIV controller patients with long-term non-progressor or Elite controller disease course35 (non-progressors, black box) and in aviremic cART-treated patients (progressors, grey box). Box-plot analysis shows twenty-fifth and seventy-fifth percentiles (box) with median (line); vertical lines express s.d.; *P<0.05, Mann–Whitney U-test. (20 cART-treated progressor and 20 non-progressor patients).

